Use G Chart to monitor the number of opportunities or, in many cases, the number of days between rare events, such as infections or surgical complications. When you monitor rare events with a traditional chart, such as a P or a U chart, you need a large amount of data to establish accurate control limits. Therefore, collecting enough rare event data to detect an adverse change in the frequency of events may take months or even years. With a G chart, you do not need to collect large amounts of data to detect special causes in rare events.
For example, a hospital wants to monitor the number of medication errors in the emergency room to ensure that errors remains low over time. Hospital staff record the date of each medication error in the emergency room. Because this data is rare event data, the hospital staff uses a G chart to track the rate of errors. 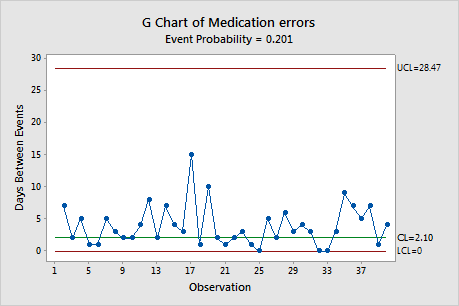
Where to find this control chart
To create a G chart, choose .
When to use an alternate control chart
If your data are the exact time and date of each event or elapsed time between events, use T Chart.