About collecting data in subgroups
You can use individual observations or data in subgroups for capability analysis. Be sure to collect data during a long enough period of time to represent the different sources of process variation.
When possible, collect data in rational subgroups, which are small samples of similar items (usually 3 to 5) that are produced during a short period of time. Subgroups should be representative of the output from the process you want to evaluate. The items in each subgroup are collected under the same inputs and conditions, such as personnel, equipment, suppliers, or environment. Therefore, when you estimate the variation in these small subgroups, you estimate the natural or inherent variation of the process.
Subgroups should be collected close together in time but still be independent of each other. For example, a die cut machine produces 100 plastic parts per hour. The quality engineer measures five randomly selected parts every hour. Each sample of five parts is a subgroup.
How subgroups relate to process variation
There are two types of variation in a process: within-subgroup variation and between-subgroup variation. To improve process quality, you should make an effort to eliminate between-subgroup variation and to reduce within-subgroup variation.
- Within-subgroup variation
- The variation between measurements within subgroups; also known as common-cause variation.
- Between-subgroup variation
- The variation that exists between subgroups that may be caused by specific identifiable factors, or special causes.
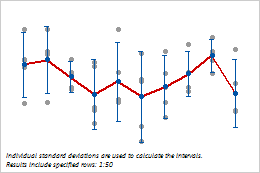
Within and between subgroup variation
This individual value plot displays the values of the samples taken from the die cut machine. Each vertical line of plotted points represents values in a subgroup. The intervals represent the within-subgroup variation, and the mean connect line represents the between-subgroup variation.
When you cannot collect rational subgroups, estimate between-subgroup variation
Sometimes it is not possible or practical to collect rational subgroups so that all the variation due to common causes is present in each subgroup.
For example, you may produce a large number of parts from the same batch or lot of raw materials. If each subgroup is sampled from a separate batch, then the within-subgroup variation will not explain the variation between batches. The between-subgroup variation needs to be estimated separately. The between-subgroup and within-subgroup variations can then be combined for the total effect of common-cause variation.
How does the subgroup size affect the estimates of process variation?
For Normal Capability Analysis and Nonnormal Capability Analysis, you can use subgroups of any size, including subgroups of size 1. You can also use subgroups of varying size within the same analysis.
The overall variation of the process, as measured by the overall standard deviation, does not change for varying subgroup sizes because its calculation depends on the total sample size, not on the subgroup sample size.
Even when the subgroup size is 1, the within-subgroup and overall standard deviations yield different values. However, if there is negligible variation between the subgroups, then these two estimates will be approximately equal.
With Between/Within Capability Analysis, your subgroup sizes must meet the following requirements.
- Subgroup size > 1
- When the subgroup size is 1, the only way to estimate within-subgroup standard deviation is to use adjacent subgroups. This is appropriate when you can assume that there is no variation between the subgroups, as is usually the case for a normal capability analysis. However, when there is likely to be significant variation between subgroups, it is necessary to have at least two observations for each subgroup to calculate within-subgroup variation and perform a between/within capability analysis.
- Most subgroups must be the same size
- To calculate the between and between/within standard deviations, more than half of the subgroups must be the same size.
Example of varying subgroup size requirements
Suppose you have one subgroup of size 5, one subgroup of size 7, and one subgroup of size 4. Each of the subgroup sizes appears once for a total of three subgroups. Therefore each subgroup size occurs one-third of the time and no one subgroup size occurs more than half of the time. You would have to add two more subgroups of size 5 (for example) to create a situation where one subgroup size is used for more than half of the subgroups.
Important
If your subgroup size does not meet these requirements when you perform Between/Within Capability Analysis, Minitab displays the following error messages:
- * ERROR * "Invalid subgroup size. The following is too small: "1". Please specify: one column or one constant."
- * ERROR * More than half the subgroups must be the same size."
How to define subgroups in the worksheet
When you perform capability analysis, Minitab assumes that the data are entered in the worksheet in time order. Therefore, observations for the same subgroup must be in adjacent rows. A column of subgroup IDs can be used to define the subgroups.
For example, this worksheet shows data for 3 subgroups. Each subgroup has three observations.
| Measurement | Subgroup ID |
|---|---|
| 0.9 | 1 |
| 1.2 | 1 |
| 1.3 | 1 |
| 1.7 | 2 |
| 1.2 | 2 |
| 1.5 | 2 |
| 1.5 | 3 |
| 1.2 | 3 |
| 1.2 | 3 |
Each time a value in the subgroup ID column changes, Minitab interprets the new value as the start of a separate subgroup. Therefore, if identical values in a subgroup ID column do not appear in adjacent rows, Minitab interprets them as different subgroups.
For example, this worksheet shows data for 6 subgroups. Each subgroup has two observations.
| Measurement | Subgroup ID | Date |
|---|---|---|
| 11.3 | 1 | 3/1 |
| 10.1 | 1 | 3/1 |
| 10.0 | 2 | 3/1 |
| 9.3 | 2 | 3/1 |
| 14.0 | 3 | 3/1 |
| 10.2 | 3 | 3/1 |
| 11.1 | 1 | 3/2 |
| 13.0 | 1 | 3/2 |
| 9.2 | 2 | 3/2 |
| 9.7 | 2 | 3/2 |
| 12.7 | 3 | 3/2 |
| 12/1 | 3 | 3/2 |
Notice that the same values (1, 2, 3) are used in nonadjacent rows in the subgroup ID column. Therefore, subgroup 1 on 3/1 is considered a separate subgroup from subgroup 1 on3/2, subgroup 2 on 3/1 is considered a separate subgroup from subgroup 2 on 3/2, and so on.
How to move observations from the same subgroup from nonadjacent rows into adjacent rows
If repeated subgroup IDs in nonadjacent rows refer to measurements that actually belong to the same subgroup, you must move them to adjacent rows before you perform capability analysis. You can use the Sort command to do this.
For example, in this worksheet, observations for the same subgroup use the same subgroup ID (1, 2, or 3) but the observations are not in adjacent rows.
| Measurement | Subgroup ID |
|---|---|
| 112.3 | 1 |
| 110.1 | 2 |
| 109.9 | 3 |
| 99.3 | 1 |
| 104.0 | 2 |
| 110.2 | 3 |
| 100.1 | 1 |
| 103.2 | 2 |
| 102.2 | 3 |
| 101.7 | 1 |
| 98.2 | 2 |
| 99.0 | 3 |
- Choose .
- Under Columns to sort by, in Column, enter Subgroup ID.
- In Columns to sort, select All columns.
- Click OK.
The data in the worksheet now appear with identical subgroup IDs in adjacent columns. When you perform capability analysis, all of the observations with the same subgroup ID are analyzed as a single subgroup.
| Sorted Measurement | Sorted Subgroup ID |
|---|---|
| 112.3 | 1 |
| 99.3 | 1 |
| 100.1 | 1 |
| 101.7 | 1 |
| 110.1 | 2 |
| 104.0 | 2 |
| 103.2 | 2 |
| 98.2 | 2 |
| 109.9 | 3 |
| 110.2 | 3 |
| 102.2 | 3 |
| 99.0 | 3 |
For more information on sorting data, go to How Minitab sorts data.