When you perform a nonnormal capability analysis in Minitab, the overall capability indices are calculated by default using the Z-score method.
Converting the specification limits
To calculate the Z-score, Minitab first determines proportions of observations that are outside the specification limits based on the nonnormal distribution that you specified for the analysis.
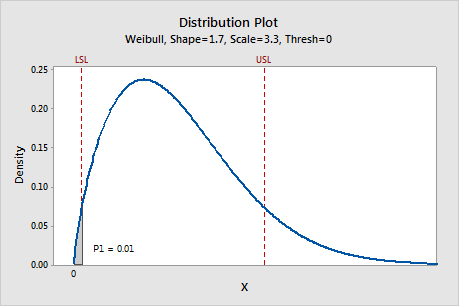
The shaded region on this graph represents P1, which is the probability that the measurements X are less than the lower specification limit (LSL) using the nonnormal distribution specified for the analysis. In this example, the specified nonnormal distribution is Weibull, the parameters are estimated from the data, and P1 = 0.01.
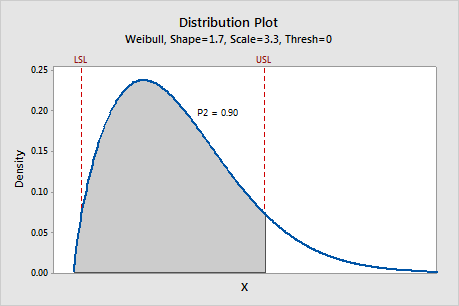
The shaded region on this graph represents P2, which is the probability that the measurements X are less than the upper specification limit (USL) using the nonnormal distribution specified for the analysis. In this example, the specified nonnormal distribution is Weibull, the parameters are estimated from the data, and P2 = 0.90.
The probabilities P1 and P2 are then used to calculate the corresponding Z-values for a standard normal distribution. In this way, the original specification limits can be represented by corresponding Z values on the standard normal scale.
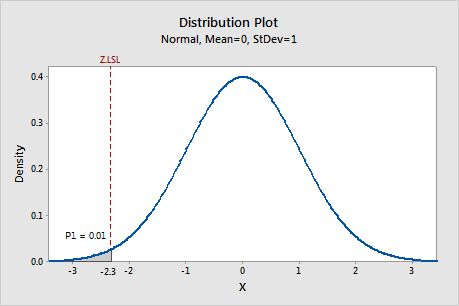
When P1 is represented on a standard normal distribution, the corresponding Z-value that is determined by P1 is called Z.LSL, which is the lower specification limit in the standard normal scale. In this example, Z.LSL is approximately −2.3.
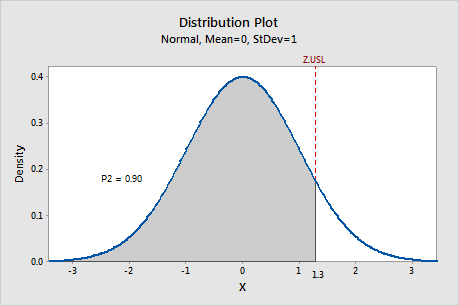
When P2 is represented on a standard normal distribution, the corresponding Z-value that is determined by P2 is called Z.USL, which is the upper specification limit in the standard normal scale. In this example, Z.USL is approximately 1.3.
To determine the specification spread in the standard normal distribution, the value of Z.LSL is subtracted from the value of Z.USL.
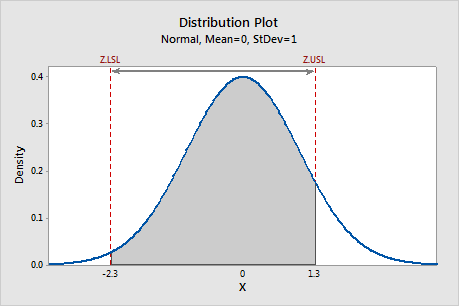
In this example, the specification spread is 1.3 - (−2.3) = 3.6, as shown by the arrow.
Calculating the nonnormal capability indices
The overall capability indices are then calculated based on the relationship between the standard normal specification spread and a specific spread of the standard normal distribution.
Pp is the ratio of the standard normal specification spread to the 6-sigma spread (6), which captures 99.74% of the process measurements from the standard normal distribution.
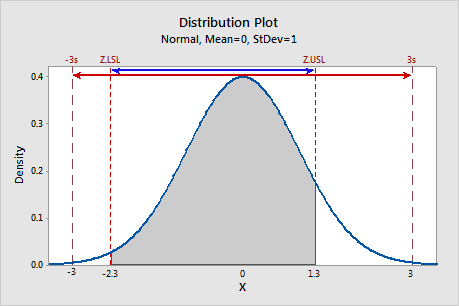
In this example, Pp equals 3.6/6 ≈ 0.6.
PPL is the ratio of the one-sided specification spread relative to the lower spec limit (Z.LSL) over the one-half the 6-sigma spread (3).
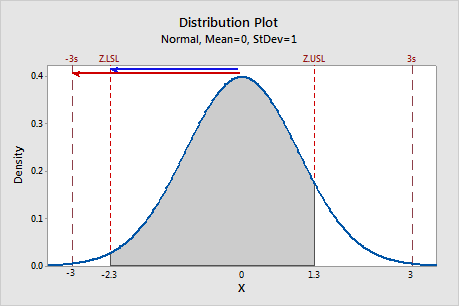
In this example, PPL equals −2.3/-3 ≈ 0.76.
PPU is the ratio of the one-sided specification spread relative to the upper spec limit (Z.USL) over one-half the 6-sigma spread (3).
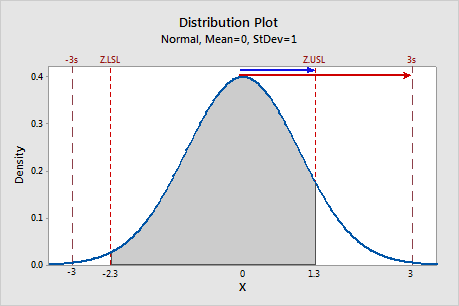
In this example, PPU equal 1.3/3 ≈ 0.43.
Ppk is the minimum of PPU and PPL. Therefore, in this example, Ppk equals PPU ≈ 0.43.