Example of using the CDF to evaluate fill weights
For example, soda can fill weights follow a normal distribution with a mean of 12 ounces and a standard deviation of 0.25 ounces. The probability density function (PDF) describes the likelihood of possible values of fill weight. The CDF provides the cumulative probability for each x-value.
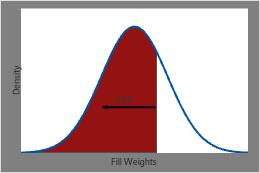
The CDF for fill weights at any specific point is equal to the shaded area under the PDF curve to the left of that point.
Use the CDF to determine the probability that a randomly chosen can of soda will have a fill weight less than 11.5 ounces, greater than 12.5 ounces, or between 11.5 and 12.5 ounces.
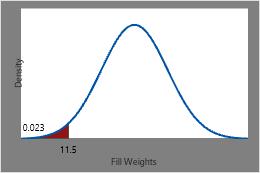
The probability of a randomly chosen can of soda having a fill weight less than or equal to 11.5 ounces is the CDF at 11.5 or approximately 0.023.
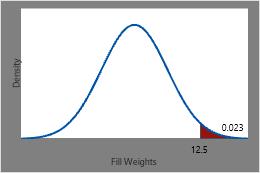
The probability that a randomly chosen can of soda has a fill weight that is greater than 12.5 ounces is 1 minus the CDF at 12.5 (0.977), or approximately 0.023.
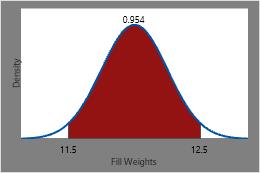
The probability of a randomly chosen can of soda having a fill weight between 11.5 ounces and 12.5 ounces is the CDF at 12.5 minus the CDF at 11.5 or approximately 0.954.
Use the CDF to calculate p-values
In order to calculate a p-value for an F-test, you must first calculate the cumulative distribution function (CDF). The p-value is 1 – CDF.
Suppose you perform a multiple linear regression analysis with the following degrees of freedom: DF (Regression) = 3; DF (Error) = 25; and the F-statistic = 2.44.
Calculate a p-value for the F-test
- Choose .
- Choose Cumulative probability.
- In Noncentrality parameter, enter 0.
- In Numerator degrees of freedom, enter 3.
- In Denominator degrees of freedom, enter 25.
- Choose Input constant and enter 2.44.
- In Optional storage, enter K1. Click OK. K1 contains the cumulative distribution function.
Use the Calculator to subtract the p-value from 1
- Choose .
- In Store result in variable, enter P-value.
- In Expression, enter 1-K1. Click OK.
Note
This example is for an F-distribution; however, you can use a similar method for other distributions.