Create a plot that shows the specified distribution with different parameter values.
- Choose .
- Select the distribution and enter multiple parameters for the distribution. For more information, go to Select the distribution and parameters.
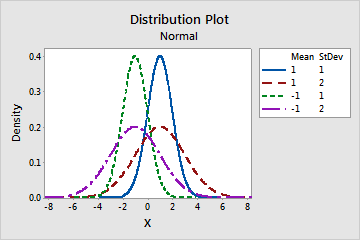
For example, this plot shows four normal distributions with different mean and standard deviation values.