Create a plot that shows two distributions with the parameters that you specify.
- Choose .
- Under Distribution 1, select the first distribution and enter the parameters for the distribution. For more information, go to Select the distribution and parameters.
- Under Distribution 2, select the second distribution and enter the parameters for the distribution. For more information, go to Select the distribution and parameters.
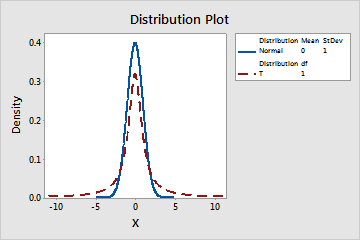
For example, this plot shows a t-distribution with 1 degree of freedom, and a standard normal distribution with mean = 0 and standard deviation = 1.