Complete the following steps to specify the data for your graph.
- In Graph variables, enter multiple columns of numeric or date/time data that you want to graph.
- In Label column (optional), enter one column of categorical data with labels for the series. If you don't enter a label column, Minitab labels the groups formed by the rows with the row number.
- Under Series Arrangement, select one of the following:
- Each row forms a series: Rows form the series. The rows are labeled with the values in the label column. On the graph below, rows forms the series.
- Each column forms a series: Graph variables form the series. On the graph below, the columns in the worksheet are the graph variables for the series.
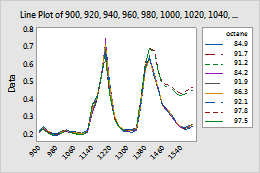
In the following worksheet, 900 through 1600 are the graph variables, and octane is the label column. The graph shows the chromatogram profile for each octane of gasoline.
| C1 | C2 | C3 | ... | C37 |
|---|---|---|---|---|
| 900 | 920 | 940 | ... | octane |
| 0.213751 | 0.236162 | 0.211233 | ... | 84.9 |
| 0.221843 | 0.241514 | 0.216588 | ... | 91.7 |
| 0.220893 | 0.241153 | 0.215574 | ... | 91.2 |
| ... | ... | ... | ... | ... |