Use the
Graph
Builder
to visualize your data and explore graph alternatives. Based on your input, the
Graph
Builder
displays a preview of available graph candidates. As you explore the graph
gallery, you can choose a graph candidate, then set options for the selected
graph to see the effects of your changes in real-time.
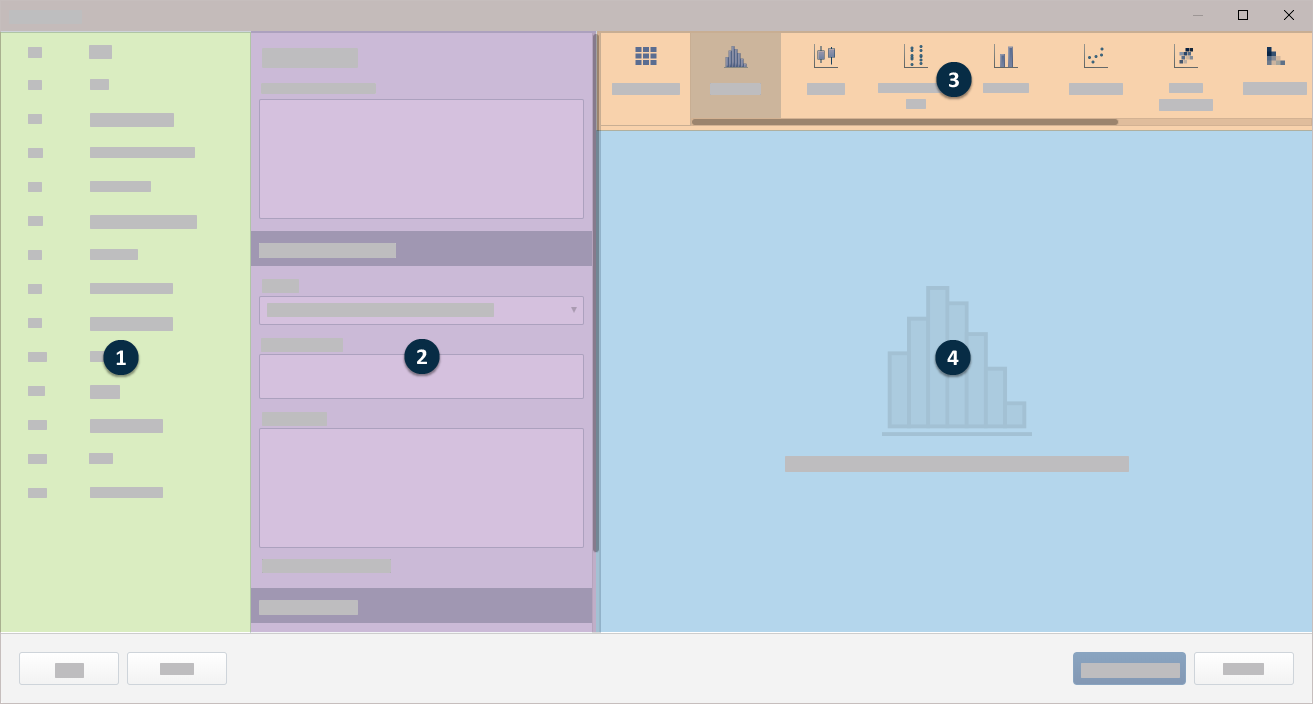
Main areas
The
Graph
Builder
is composed of four main areas.
- 1: Column selector panel
- A list of the columns in the active worksheet.
- 2: Source data panel
- The available input fields and any display options associated with the selected graph.
- 3: Candidates list
- The complete list of all available graphs.
- 4: Canvas
- The area where Minitab displays the graph previews.
Tips
When working with variables in the
Graph
Builder,
consider the following tips:
- To enter variables with the mouse, click the variable in the column selector panel and drag it to an input field in the source data panel.
- To enter variables with the keyboard, click in or tab to the input field and type the column name or column number of the variable to enter, such as C1 or Flaws.
- To rearrange the order of the variables on the graph, click a variable in an input field and drag it to a new location in the same field or to a different field within the source data panel.
- To delete variables from the
source data panel, click the
 in the variable name or
select the variable and press the
Delete key.
in the variable name or
select the variable and press the
Delete key.
Explore graph alternatives
When you are unsure about which graph to choose, use the
Gallery
to explore a variety of graph types.
- Choose .
- In the Graph Builder, click Gallery.
-
From the column selector panel, click the variables and drag them to
the source data panel. The
Graph
Builder
generates all possible graph types based on your input.
Tip
You can also click in or tab to the input field and type the column name or column number of the variable to enter, such as C1 or Flaws.
- From the canvas, browse the graph thumbnails to determine which graphs to explore further. The thumbnails are scaled-down representations of the graphs created from the inputs that you entered.
- (Optional) To narrow your selection, click All in the upper-right section of the canvas, and choose an option to see graphs that match the filter criteria.
-
Click a gallery thumbnail to select a graph.
The data source panel presents settings specific to the selected graph.
-
Experiment with different settings to see the effects of your changes
in real-time.
Tip
To rearrange the order of the variables on the graph, click a variable in an input field and drag it to a new location in the same field or to a different field within the source data panel.
- (Optional) When your inputs result in multiple graphs of a specific type, scroll through the set of thumbnails at the bottom of the canvas and select one to see a preview of an alternate graph.
Select and customize a graph
When you know which type of graph you want to create, select it from
the candidates list. After you select a graph, the source data panel presents
graph-specific options.
- Choose .
-
In the
Graph
Builder,
click a graph type from the candidates list.
The data source panel presents settings specific to the selected graph.
-
From the column selector panel, click the variables of interest and
drag them to input fields available for the selected graph type.
Tip
You can also click in or tab to the input field and type the column name or column number of the variable to enter, such as C1 or Flaws.
-
Change the settings to see the effects of your changes in real-time.
Tip
To rearrange the order of the variables on the graph, click a variable in an input field and drag it to a new location in the same field or to a different field within the source data panel.
- (Optional) When your inputs result in multiple graphs of a specific type, scroll through the set of thumbnails at the bottom of the canvas and select one to see a preview of an alternate graph.