Use Bar Chart to compare the counts, the means, or other summary statistics, using bars to represent groups or categories. The height of the bar shows either the count, the variable function (mean, sum, standard deviation, and so on), or the summary value for the group.
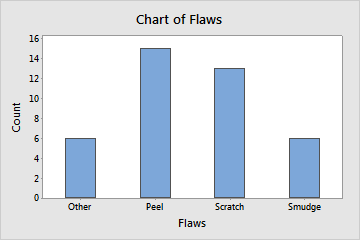
For example, in the following bar chart, bars represent the counts of paint flaws on an automobile part.
Where to find this graph
To create a bar chart, choose .