A development team for a metal parts supplier plans a designed experiment to study a new part for a motor. Before conducting the experiment, the team wants to ensure that they have enough resources to do an experiment with enough power. The team plans to examine three external coatings and three alloys on the corrosion resistance of the new part. The team wants their design to have 90% power to detect a difference of 0.4 between the best and worst factor levels. The estimated standard deviation is 0.15. If the design requires more than 1 replicate, then the team wants to use a separate block of experimental runs for each replicate.
- Choose .
- In Number of levels for each factor in the model, enter 3 3.
- In Values of the maximum difference between main effect means, enter 0.4.
- In Power values, enter 0.9.
- In Standard deviation, enter 0.15.
- Click Design.
- Select Include blocks in model (design blocked on replicates).
- Click OK in each dialog box.
Interpret the results
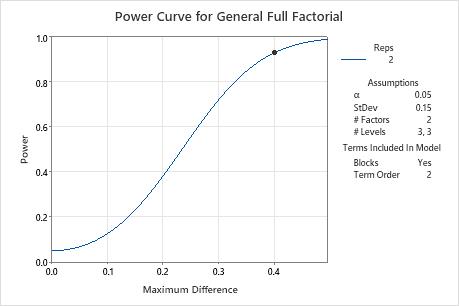
Because the team considered one value for power and one value for maximum difference, the solution includes one value for the number of replicates. A design with 2 replicates and 18 experimental runs has a power greater than 90%, which meets the team's requirements. The power curve shows the relationship between power and the size of the maximum difference. The symbol on the curve represents the effect size of 0.4 that the team specified. The team decides that they have enough resources for 18 experimental runs.
Results
| Maximum Difference | Reps | Total Runs | Target Power | Actual Power |
|---|---|---|---|---|
| 0.4 | 2 | 18 | 0.9 | 0.930521 |