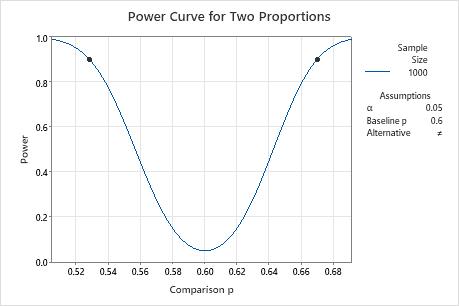
A university financial aid officer wants to determine whether male or female students are more likely to get a job in the summer. Results from a previous study suggest that 60% of students get a job in the summer. Before collecting the data for a 2 proportions test, the officer uses a power and sample size calculation to determine how small of a difference the test can detect when the sample size is 1,000 and the power is 0.9.
- Choose .
- In Sample sizes, enter 1000.
- In Power values, enter 0.9.
- In Baseline proportion (p2), enter 0.6.
- Click OK.
Interpret the results
With a sample size of 1,000 and a power value of 0.9, the officer can detect a difference between proportions of approximately 7% in either direction. This difference is adequate, so the officer collects the data for the 2 proportions analysis.
Test for Two Proportions
Testing comparison p = baseline p (versus ≠)
Calculating power for baseline p = 0.6
α = 0.05
Results
| Sample Size | Power | Comparison p |
|---|---|---|
| 1000 | 0.9 | 0.669724 |
| 1000 | 0.9 | 0.528190 |