In This Topic
Difference
If you selected a hypothesis about the difference between means, Minitab displays the difference between the test mean and the reference mean from your samples.
Interpretation
The mean of the test sample is an estimate of the mean of the test population. The mean of the reference sample is an estimate of the mean of the reference population. Therefore, the difference between the sample means provides an estimate of the difference between the mean of the test population and the mean of the reference population.
Because the difference is based on sample data and not on entire populations, you cannot be certain that it equals the difference between the mean of the test population and the mean of the reference population. To assess the precision of the estimate for the populations, you can use a confidence interval.
StDev
The standard deviation (StDev) of the differences is a measure of dispersion, or how much the paired differences vary relative to the mean of the paired differences.
Interpretation
Use the standard deviation of the differences to determine how spread out the paired differences are from the mean of the paired differences. Higher values indicate more variation or "noise" in the data.
The standard deviation of the differences is used to calculate the standard error of the difference.
SE
The standard error of the difference (SE) estimates the variability of the difference between the test mean and the reference mean that you would obtain if you took repeated samples from the same populations. The standard error of the difference estimates the variability between samples, whereas the standard deviation measures the variability within a single sample.
For example, suppose you have a difference between the sample test mean and the sample reference mean of −0.12122 units. The test sample of 10 data values has a standard deviation of 0.26138. The reference sample of 9 data values has a standard deviation of 0.58064. The standard error of the difference equals the square root of the sum (0.58064/10 + 0.26138/9), or 0.20324. If you collected multiple random samples of the same size and from the same population, the standard deviation of the differences between the samples would be approximately 0.20324.
Interpretation
Use the standard error of the difference to determine how precisely the difference between the sample means estimates the difference between the mean of the test population and the mean of the reference population.
Lower values of the standard error indicate a more precise estimate. Usually, a larger standard deviation results in a larger standard error of the difference and a less precise estimate. A larger sample size results in a smaller standard error of the difference and a more precise estimate.
Minitab uses the standard error of the difference to calculate the test statistics (t-values).
Ratio
If you selected a hypothesis about the ratio of the means, Minitab calculates the ratio of the mean of the test sample to the mean of the reference sample.
Interpretation
The mean of the test sample is an estimate of the mean of the test population. The mean of the reference sample is an estimate of the mean of the reference population. Therefore, the ratio of the sample means provides an estimate of the ratio of the mean of the test population to the mean of the reference population.
Because the ratio is based on sample data and not on entire populations, you cannot be certain that it equals the population ratio. To assess the precision of the estimate for the populations, you can use a confidence interval.
Confidence interval (CI)
The confidence interval provides a range of likely values for the difference (or ratio) between the mean of the test population and the mean of the reference population. The lower confidence limit defines a value that the difference (or ratio) is likely to be greater than. The upper confidence limit defines a value that the difference (or ratio) is likely to be less than.
Note
If you perform an equivalence test using the default settings, Minitab displays a confidence interval for equivalence. If you change the default setting and use the alternate method for calculating the confidence interval, Minitab displays a standard confidence interval. For information on the difference between these intervals, go to Confidence intervals in equivalence testing.
Interpretation
Compare the confidence interval with the equivalence limits. If the confidence interval is completely within the equivalence limits, you can claim that the mean of the test population is equivalent to the mean of the reference population. If part of the confidence interval is outside the equivalence limits, you cannot claim equivalence.
Difference: Mean(Discount) - Mean(Original)
| Difference | SE | 95% CI for Equivalence | Equivalence Interval |
|---|---|---|---|
| -0.12122 | 0.20324 | (-0.483449, 0.241005) | (-0.5, 0.5) |
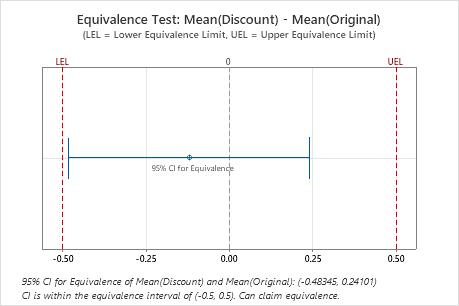
In these results, the 95% confidence interval is completely within the equivalence interval defined by the lower equivalence limit (LEL) and the upper equivalence limit (UEL). Therefore, you can conclude that the test mean is equivalent to the reference mean.
Lower bound
Minitab displays a lower confidence bound if you select an alternative hypothesis that includes only a lower limit for the difference (or ratio). The lower bound indicates a value that the difference (or ratio) between the mean of the test population and the mean of the reference population is likely to be greater than.
Interpretation
Use the lower confidence bound to determine whether the difference (or ratio) between the mean of the test population and the mean of the reference population is greater the lower limit. If the lower confidence bound is greater than the lower limit, you can claim that the difference (or ratio) between the mean of the test population and the mean of the reference population is greater than the lower limit.
Difference: Mean(Generic) - Mean(Brand)
| Difference | SE | 95% Lower Bound | Lower Limit |
|---|---|---|---|
| -0.32104 | 0.060641 | -0.42735 | -0.42503 |
In these results, the 95% lower confidence bound for the difference is −0.42735, which is less than the lower limit of −0.42503. Therefore, you cannot claim that the difference between the mean of the test population and the mean of the reference population is greater than the lower limit.
Upper bound
Minitab displays an upper confidence bound if you select an alternative hypothesis that includes only an upper limit for the difference (or ratio). The upper bound indicates a value that the difference (or ratio) between the mean of the test population and the mean of the reference population is likely to be less than.
Interpretation
Use the upper confidence bound to determine whether the difference (or ratio) between the mean of the test population and the mean of the reference population is less than the upper limit. If the upper confidence bound is less than the upper limit, you can claim that the difference (or ratio) between the mean of the test population and the mean of the reference population is less than the upper limit.
Difference: Mean(Generic) - Mean(Brand)
| Difference | SE | 95% Upper Bound | Upper Limit |
|---|---|---|---|
| -0.32104 | 0.060641 | -0.21473 | 0.42503 |
In these results, the 95% upper confidence bound for the difference is −0.21473, which is less than the upper limit of 0.42503. Therefore, you can be 95% confident that the difference between the mean of the test population and the mean of the reference population is less than the upper limit.
Equivalence interval
An equivalence interval is a range of values that are close enough to the reference mean to be considered equivalent. The interval is based on your knowledge of the product or process and is defined by a lower equivalence limit (LEL) and an upper equivalence limit (UEL).
Interpretation
Compare the confidence interval with the equivalence limits. If the confidence interval is completely within the equivalence limits, you can claim that the mean of the test population is equivalent to the mean of the reference population. If part of the confidence interval is outside the equivalence limits, you cannot claim equivalence.
Difference: Mean(Generic) - Mean(Brand)
| Difference | SE | 95% CI for Equivalence | Equivalence Interval |
|---|---|---|---|
| -0.32104 | 0.060641 | (-0.427349, 0) | (-0.425035, 0.425035) |
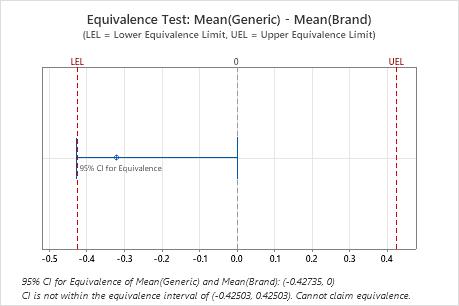
In these results, the 95% confidence interval is not completely within the equivalence interval defined by the lower equivalence limit (LEL) and the upper equivalence limit (UEL). The lower bound of the confidence interval extends beyond the lower equivalence limit. Therefore, you cannot conclude that the test mean is equivalent to the reference mean.
Lower limit
The lower limit of acceptability for the difference (or ratio) between the test mean and the reference mean. You want the difference (or ratio) between the mean of the test population and the mean of the reference population to be greater than the lower limit.
Interpretation
Compare the lower limit with the lower confidence bound.If the lower confidence bound is greater than the lower limit, you can claim that the difference (or ratio) between the mean of the test population and the mean of the reference population is greater than the lower limit.
Difference: Mean(Generic) - Mean(Brand)
| Difference | SE | 95% Lower Bound | Lower Limit |
|---|---|---|---|
| -0.32104 | 0.060641 | -0.42735 | -0.42503 |
In these results, the 95% lower confidence bound for the difference is −0.42735, which is less than the lower limit of −0.42503. Therefore, you cannot claim that the difference between the mean of the test population and the mean of the reference population is greater than the lower limit.
Upper limit
The upper limit of acceptability for the difference (or ratio) between the test mean and the reference mean. You want the difference (or ratio) between the mean of the test population and the mean of the reference population to be less than upper limit.
Interpretation
Compare the upper limit with the upper confidence bound. If the upper confidence bound is less than the upper limit, you can claim that the difference (or ratio) between the mean of the test population and the mean of the reference population is less than the upper limit.
Difference: Mean(Generic) - Mean(Brand)
| Difference | SE | 95% Upper Bound | Upper Limit |
|---|---|---|---|
| -0.32104 | 0.060641 | -0.21473 | 0.42503 |
In these results, the 95% upper confidence bound for the difference is −0.21473, which is less than the upper limit of 0.42503. Therefore, you can be 95% confident that the difference between the mean of the test population and the mean of the reference population is less than the upper limit.