In This Topic
Descriptive statistics
Descriptive statistics provide a concise summary of data. You can summarize data numerically or graphically. For example, the manager of a fast food restaurant tracks the wait times for customers during the lunch hour for a week and summarizes the data.
| Statistic | Sample value |
|---|---|
| Mean | 6.2 minutes |
| Standard deviation | 1.5 minutes |
| Range | 3 to 10 minutes |
| N (sample size) | 50 |
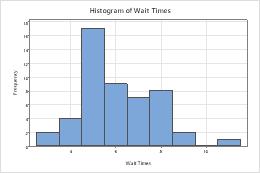
Histogram of wait times
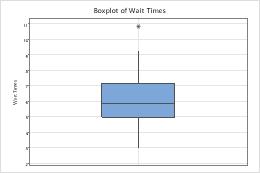
Boxplot of wait times
Inferential statistics
Inferential statistics use a random sample of data taken from a population to describe and make inferences about the population. Inferential statistics are valuable when it is not convenient or possible to examine each member of an entire population. For example, it is impractical to measure the diameter of each nail that is manufactured in a mill, but you can measure the diameters of a representative random sample of nails and use that information to make generalizations about the diameters of all the nails produced.