A quality control engineer needs to ensure that the caps on shampoo bottles are fastened correctly. If the caps are fastened too loosely, they may fall off during shipping. If they are fastened too tightly, they may be too difficult to remove. The target torque value for fastening the caps is 18. The engineer collects a random sample of 68 bottles and tests the amount of torque that is needed to remove the caps.
As part of the initial investigation, the engineer analyzes the descriptive statistics and graphs to assess the distribution of the data.
- Open the sample data, CapTorque.MWX.
- Choose .
- In Variables, enter Torque.
- Click OK.
Interpret the results
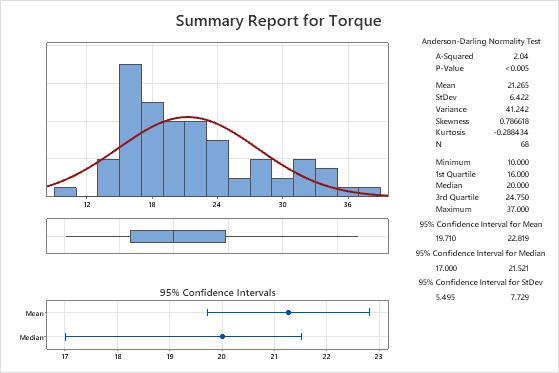
The mean torque that is required to remove caps is 21.265, with a standard deviation of 6.422. The histogram shows a wide spread, with many values falling far from the target value of 18. The 95% confidence interval shows that a likely range for the population mean torque is between 19.710 and 22.819, which is greater than the target of 18. To investigate the difference between the mean torque and the target value, the engineer could use a 1-sample t-test.