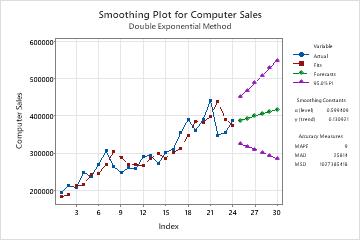
An online retailer wants to predict computer sales for the next six months. The retailer collects data on computer sales and software sales from the previous two years to predict future trends.
- Open the sample data, ComputerSales.MTW.
- Choose .
- In Variable, enter Computer Sales.
- Select Generate forecasts. In Number of forecasts, enter 6.
- Click OK.
Interpret the results
On this smoothing plot, the fitted values closely follow the actual data. The forecasts predict a slight upward trend in sales for the next 6 months.
Method
| Data | Computer Sales |
|---|---|
| Length | 24 |
Smoothing Constants
| α (level) | 0.599409 |
|---|---|
| γ (trend) | 0.130921 |
Accuracy Measures
| MAPE | 9 |
|---|---|
| MAD | 25814 |
| MSD | 1027385418 |
Forecasts
| Period | Forecast | Lower | Upper |
|---|---|---|---|
| 25 | 387788 | 324546 | 451030 |
| 26 | 393620 | 318188 | 469051 |
| 27 | 399452 | 310644 | 488260 |
| 28 | 405284 | 302374 | 508193 |
| 29 | 411116 | 293640 | 528591 |
| 30 | 416948 | 284595 | 549300 |

