Select the method or formula of your choice.
ACF
The graphs for the autocorrelation function (ACF) of the ARIMA residuals include lines that represent the significance limits. Values that extend beyond the significance limits are statistically significant at approximately α = 0.05, and show evidence that the autocorrelation does not equal zero.
Formula
Notation
| Term | Description |
|---|---|
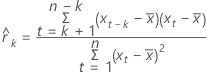
| k | lag; k = 1, 2,... |
| xt | value of x at row t |
 | mean of x |
| n | number of observations in the series |
Standard error of ACF
Formula
Notation
| Term | Description |
|---|---|
 |  |
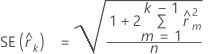
| k | lag; k = 1, 2, ... |
| n | number of observations in the series |
 | autocorrelation of lag m |
t-statistics
Formula

Notation
| Term | Description |
|---|---|
 | autocorrelation at lag k; k = 1, 2, ... |
 | standard error of the autocorrelation at lag k |
Significance limits
Formula
Upper limit at lag k = t n−1; 0.975 × SE(rk )
Lower limit at lag k = t n−1; 0.025 × SE(rk )
Notation
| Term | Description |
|---|---|
| SE(rk ) | standard error of the autocorrelation at lag k |
| t n-1; 0.975 | 97.5th percentile of the t distribution with n – 1 degrees of freedom |
| t n-1; 0.025 | 2.5th percentile of the t distribution with n – 1 degrees of freedom |
Ljung-Box Q statistic
Formula
Notation
| Term | Description |
|---|---|
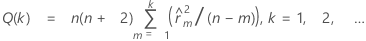
| n | number of observations in a series |
 | estimated autocorrelation at lag m; m = 1, 2, ..., k |
| k | lag; k = 1, 2, ... |