In This Topic
Fitted line plot
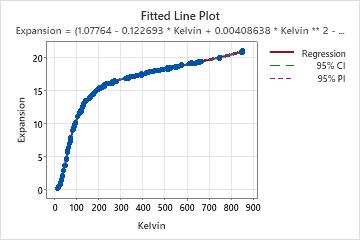
If your nonlinear model contains one predictor, Minitab displays the fitted line plot to show the relationship between the response and predictor data. The plot includes the regression line, which represents the regression equation. You can also choose to display the 95% confidence and prediction intervals on the plot.
Interpretation
- The sample contains an adequate number of observations throughout the entire range of all the predictor values.
- The model properly fits the curvature in the data. To determine which model is best, examine the plot, the standard error of the regression (S), and the Lack-of-Fit test when your data contain replicates.
- Look for any outliers, which can have a strong effect on the results. Try to identify the cause of any outliers. Correct any data entry or measurement errors. Consider removing data values that are associated with abnormal, one-time events (special causes). Then, repeat the analysis. For more information on detecting outliers, go to Unusual observations.
Equation
Use the regression equation to describe the relationship between the response and the terms in the model. The regression equation is an algebraic representation of the regression line. Enter the value of each predictor into the equation to calculate the mean response value. Unlike linear regression, a nonlinear regression equation can take many forms.
For nonlinear equations, determining the effect that each predictor has on the response can be less intuitive than it is for linear equations. Unlike the parameter estimates in linear models, there is no consistent interpretation for the parameter estimates in nonlinear models. The correct interpretation for each parameter depends on the expectation function and the parameter's place in it. If your nonlinear model contains only one predictor, assess the fitted line plot to see the relationship between the predictor and response.
Convergence on a solution does not necessarily guarantee that the model fit is optimal or that the sum of squared errors (SSE) are minimized. Convergence on incorrect parameter values can occur due to a local SSE minimum or an incorrect expectation function. Therefore, it is crucial to examine the parameter values, fitted line plot, and residual plots, to determine if the model fit and parameter values are reasonable.
Interpretation
In these results, there is one predictor and seven parameter estimates. The response variable is Expansion and the predictor variable is temperature on the Kelvin scale. The lengthy equation describes the relationship between the response and the predictors. The effect that a 1 degree Kelvin increase has on copper expansion highly depends on the starting temperature. The effect of changing temperatures on copper expansion cannot be easily summarized. Assess the fitted line plot to see the relationship between the predictor and response.
If you enter a value for temperature in Kelvin into the equation, the result is the fitted value for copper expansion.
Equation
3) / (1 - 0.00576099 * Kelvin + 0.000240537 * Kelvin ** 2 - 1.23144E-07 * Kelvin ** 3)
95% CI
The confidence interval for the fit provides a range of likely values for the mean response given the specified settings of the predictors.
Interpretation
Use the confidence interval to assess the estimate of the fitted value for the observed values of the variables.
For example, with a 95% confidence level, you can be 95% confident that the confidence interval contains the population mean for the specified values of the variables in the model. The confidence interval helps you assess the practical significance of your results. Use your specialized knowledge to determine whether the confidence interval includes values that have practical significance for your situation. A wide confidence interval indicates that you can be less confident about the mean of future values. If the interval is too wide to be useful, consider increasing your sample size.
95% PI
The prediction interval is a range that is likely to contain a single future response for a value of the predictor variable given the specified settings of the predictors.
Interpretation
For example, a materials engineer at a furniture manufacturer develops a simple regression model to predict the stiffness of particleboard from the density of the board. The engineer verifies that the model meets the assumptions of the analysis. Then, the analyst uses the model to predict the stiffness.
The regression equation predicts that the stiffness for a new observation will be 66.995 and the prediction interval is [50, 85]. While it is unlikely that the observation would have a stiffness of exactly 66.995, the prediction interval indicates that the engineer can be 95% confident that the actual value will be between 50 and 85.
The prediction interval is always wider than the corresponding confidence interval because predicting a single response is more uncertain than predicting the mean of multiple responses.