These statistics appear in the table that shows the effectiveness of the
classification for the best and worst terminal nodes. In general, rows are in
order by the size of the class probabilities. Values within 1E-12 are ties.
Minitab sorts ties by their weighted counts. If the weighted counts are also
ties, then Minitab sorts ties by the node ID.
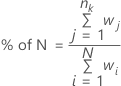
% of N
The following formula gives the percent of the data that are in the node.
This formula is for data without weights:
The following formula is for data with weights:
Notation
Term
Description
number of cases in node
k
N
number of cases in the
data set
weight for the
jth case in the node
weight for the
ith case in the data set
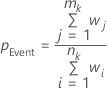
Event prob and non-event prob
Minitab refers to event probability and non-event probability for
binary response variables.
The following formula gives the percent events in the node. This formula is
for data without weights:
The following formula is for data with weights:
The non-event probability has the following definition:
Notation
Term
Description
number of events in node
k
number of cases in node
k
weight for the
jth event in the node
weight for the
ith observation in the node
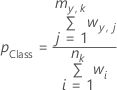
Class prob and non-class prob
Minitab refers to class probability and non-class probability for
multinomial response variables.
The following formula gives the percent for a class in the node. This
formula is for data without weights.
The following formula is for data with weights:
The non-class probability has the following definition:
Notation
Term
Description
number of cases in a class
y in node
k
number of cases in node
k
weight for the
jth case in class
y in the node
weight for the
ith case in the node
Odds
The formula for odds depends on whether the response variable is binary or
multinomial.