In This Topic
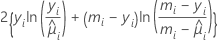
Deviance
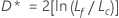
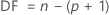
The degrees of freedom for the test depend on the sample size and the number of terms in the model:
Notation
| Term | Description |
|---|---|
| Lf | the log-likelihood for the full model |
| Lc | the log-likelihood of the model with a subset of terms from the full model |
| yi | the number of events for the ith row in the data |
 | the estimated mean response for the ith row in the data |
| mi | the number of trials for the ith row in the data |
| n | the number of rows in the data |
| p | the regression degrees of freedom |
Pearson
The generalized Pearson chi-square statistic assesses the relative difference between the observed and fitted values.
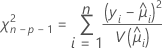
The degrees of freedom for the test depend on the sample size and the number of terms in the model. The Pearson statistic has an exact chi-square distribution for normal data. For non-normal data, like the binomial distribution and the Poisson distribution, the statistic approaches the distribution asymptotically.
Notation
| Term | Description |
|---|---|
| n | the number of rows in the data |
| p | the regression degrees of freedom |
| yi | the response value for the ith factor/covariate pattern |
 | the estimated mean response of the ith row |
| V(·) | the variance function for the model, defined below |

Hosmer-Lemeshow
The formula is:
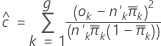
To form the groups, Minitab orders the estimated probabilities and then attempts to create 10 groups of equal size.
The expected number of events in a group is:
expected events = 
The expected value for the number of nonevents is:
expected nonevents = 
Notation
| Term | Description |
|---|---|
 | The number of trials in the kth group |
| ok | The number of events among the  factor/covariate patterns factor/covariate patterns |
 | The average estimated probability for each group |
| πi | The fitted probabilities for the factor/covariate patterns in a group |