Key results for Tolerance Intervals (Nonnormal Distribution)

Complete the following steps to interpret tolerance intervals.

Step 1: Assess the distribution fit of the data

Minitab provides tolerance intervals for a method that uses a distribution and a nonparametric method. If you can safely assume that your data follow the distribution, then you can use the tolerance interval for the method that uses the distribution. If you cannot safely assume that your data follow the distribution, then you must try a different distribution or the tolerance interval for the nonparametric method.

To determine whether you can assume that the data follow the distribution, compare the p-value from the Anderson-Darling test to the significance level (α). A significance level of 0.05 indicates a 5% risk of concluding that the data do not follow the distribution when the data do follow the distribution.

P-value ≤ α: The data do not follow the distribution (Reject H0)
If the p-value is less than or equal to the significance level, you can conclude that your data do not follow the distribution. In this case, you must try a different distribution or the tolerance interval for the nonparametric method.
P-value > α: You do not have enough evidence to conclude that the data do not follow the distribution (Fail to reject H0)
If the p-value is larger than the significance level, you do not have enough evidence to conclude that the data do not follow the distribution. In this case, you can use the tolerance interval for the method that uses the distribution.
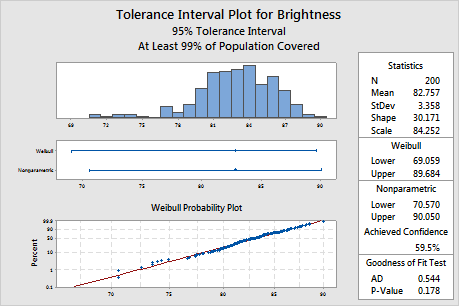
Key Results: Probability plot and p-value

The probability plot shows that the plotted points fall along the Weibull distribution fitted line, which indicates that the data follow a Weibull distribution. Also, the p-value of the goodness-of-fit test is 0.178, which is greater than the significance level of 0.05. Because you cannot conclude that the data do not follow the Weibull distribution, you can use the interval for the Weibull distribution.

Step 2: Examine the tolerance interval from the appropriate method

Minitab provides tolerance intervals for the method that uses the distribution and the nonparametric method that does not assume a particular distribution. You can create a two-sided tolerance interval, or a one-sided tolerance interval that provides an upper bound or a lower bound.
Two-sided
Use a two-sided interval to determine an interval that contains a certain minimum percentage of the population measurements.
Statistics Variable N Mean StDev Brightness 200 82.757 3.358
95% Tolerance Interval Nonparametric Achieved Variable Weibull Method Method Confidence Brightness (69.059, 89.684) (70.570, 90.050) 59.54% Achieved confidence level applies only to nonparametric method.
Key Results: 95% Tolerance Interval

The Weibull interval ranges from approximately 69.1 to 89.7, so the manufacturer can be 95% confident that at least 99% of all batches of pulp will fall in this interval. For all the batches of pulp, the mean brightness level is approximately 82.8.

Upper bound
Use an upper bound to determine a limit that exceeds a certain minimum percentage of population measurements.
95% Upper Tolerance Bound Weibull Nonparametric Achieved Variable Method Method Confidence Brightness 89.131 90.050 86.60% Achieved confidence level applies only to nonparametric method.
Key Results: 95% Upper Tolerance Bound

In this example, the Weibull upper bound is 89.131, so you can be 95% confident that 99% of all batches of pulp will have brightness measurements of 89.131 or less. If you cannot assume that the data follow a Weibull distribution, find a different distribution that fits or consider the nonparametric upper bound of 90.50. For the nonparametric method, the achieved confidence is 86.60%, which is much less than the target value of 95%. This result indicates that your sample size is too small for the nonparametric method to be accurate.

Lower bound
Use a lower bound to determine a limit that is less than a certain minimum percentage of population measurements.
95% Lower Tolerance Bound Weibull Nonparametric Achieved Variable Method Method Confidence Brightness 71.105 70.570 86.60% Achieved confidence level applies only to nonparametric method.
Key Results: 95% Lower Tolerance Bound

In this example, the Weibull lower bound is 71.105, so you can be 95% confident that 99% of all batches of pulp will have brightness measurements of 71.105 or more. If you cannot assume that the data follow a Weibull distribution, find a different distribution that fits or consider the nonparametric lower bound of 70.570. For the nonparametric method, the achieved confidence is 86.60%, which is much less than the target value of 95%. This result indicates that your sample size is too small for the nonparametric method to be accurate.