In This Topic
Number of runs about the median
The number of runs about the median is the total number of runs above the median and the total number of runs below the median.
A run about the median is one or more consecutive points on the same side of the center line. A run ends when the line that connects the points crosses the center line. A new run begins with the next plotted point.
Expected number of runs about the median
Formula
The expected number of runs above and below the median is:

Notation
| Term | Description |
|---|---|
| m | number of points > center line |
| n | number of points ≤ center line |
| N | total number of observations |
Longest run about the median
The number of points in the longest run above or below the median. A point that falls on the center line belongs to the run below the median.
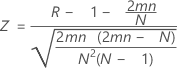
Approximate p-value for clustering
A p-value that is less than the specified level of significance indicates a tendency for clustering.
Formula
Assuming a standard normal distribution, p-value = cdf(Z).
Where:

Notation
| Term | Description |
|---|---|
| cdf | cumulative probability to Z |
| R | total number of runs |
| m | number of points > center line |
| n | number of points ≤ center line |
| N | total number of points |
Approximate p-value for mixtures
A p-value that is less than the specified level of significance indicates a tendency to mix or alternate direction, which suggests that the data may come from different processes.
Formula
Assuming a standard normal distribution, p-value = 1 – cdf(Z).
Where:
Notation
| Term | Description |
|---|---|
| cdf | cumulative probability to Z |
| R | total number of runs |
| m | number of points > center line |
| n | number of points ≤ center line |
| N | total number of points |
Number of runs up or down
The number of runs up or down is the total count of upward and downward runs in your data.
A run up is an upward run of consecutive points that exclusively increases. A run down is a downward run of consecutive points that exclusively decreases. A run ends when the direction (either up or down) changes. For example, when the preceding value is smaller, a run up begins and continues until the proceeding value is larger than the next point, then a run down begins.
Expected number of runs up or down
Formula
The expected number of runs up or down is:

Notation
| Term | Description |
|---|---|
| m | number of points > center line |
| n | number of points ≤ center line |
Longest run up or down
The number of points in the longest run up or down.
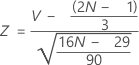
Approximate p-value for trends
A p-value that is less than the specified level of significance indicates a trend.
Formula
Assuming a standard normal distribution, p-value = cdf(Z).
Where:
Notation
| Term | Description |
|---|---|
| cdf | cumulative probability to Z |
| V | number of runs up or down |
| N | total number of points |
Approximate p-value for oscillation
A p-value that is less than the specified level of significance indicates oscillation.
Formula
Assuming a standard normal distribution, p-value = 1 – cdf(Z).
Where:

Notation
| Term | Description |
|---|---|
| cdf | cumulative probability to Z |
| V | number of runs up or down |
| N | total number of points |