In This Topic
Bias
Bias is the difference between the part's reference value and the operator's measurements of the part.
Formula
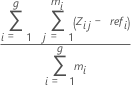
Average bias for each part:
Notation
| Term | Description |
|---|---|
| zi,j | jth measurement of the ith part |
| refi | reference value of the ith part |
| mi | number of replicates of the ith part |
%Bias
%Bias is bias expressed as a percentage of the overall process variation.
Formulas
%Bias = 100 * (|Average Bias| / Process Variation)
Notation
| Term | Description |
|---|---|
| zi,j | jth measurement of the ith part |
| refi | reference value of the ith part |
| mi | number of replicates of the ith part |
p-value for Gage Linearity and Bias Study
Use the p-values to test whether bias = 0 at each reference value, and whether the average bias =0.
The p-value is defined as the area under the sampling distribution to the right of the + |test statistic| and the area under the sampling distribution to the left of the - |test statistic|. The p-value in the output is obtained from using the t-distribution with γ df and the t-statistic.
Minitab provides specific t-statistic calculations for the sample range method and for the sample standard deviation method.
Sample range method
Minitab uses either the sample range (default) or sample standard deviation to estimate repeatability standard deviation. Repeatability standard deviation is used to calculate the t-value, which leads to the calculation of the p-value to test bias = 0 for all reference values and for each reference.
Formulas
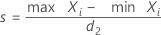
For the sample range method, when each distinct reference value corresponds to a unique part, the repeatability standard deviation:
When more than one part has the same reference value, the repeatability standard deviation:

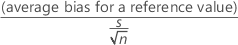
The t-statistic for testing bias is:

The degrees of freedom (γ) is obtained from a table in the AIAG manual1. Minitab uses the t distribution with γ df and the t-value to calculate the p-value.
Notation
| Term | Description |
|---|---|
| Xi | the bias of the ith measurement for a part |
| d2 | a value from a table1, with sample size = n |
 | average range |
Sample standard deviation method
Minitab uses either the sample range (default) or sample standard deviation to estimate repeatability standard deviation. Repeatability standard deviation is used to calculate the t-value, which leads to the calculation of the p-value to test bias = 0.
Formulas
For the sample standard deviation method, when one reference value corresponds to a single part, the repeatability standard deviation:

The t-statistic for testing bias is:
The degrees of freedom are n - 1. The p-value in the output is obtained from the t-distribution using the t-value and the degrees of freedom.
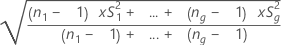
When more than one part has the same reference value, the repeatability standard deviation is the pooled sample standard deviation s across the parts with the same reference value:
The t-statistic for testing bias is:
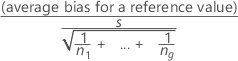
The degrees of freedom are (n1- 1) + ... + (ng - 1). The p-value in the output is obtained from the t-distribution using the t-value and the degrees of freedom.
Notation
| Term | Description |
|---|---|
| x | ith measurement of the part |
 | average measurement for the part |
| n | sample size |
| S1 | the sample standard deviation for part 1 with n1 measurements |
| Sg | the sample standard deviation for part g with ng measurements |
Confidence interval for the mean bias (95% CI)
The confidence interval is the confidence interval for the regression line with the reference values as X-values and the bias measurements as Y-values. The confidence intervals use different calculations than the hypothesis tests for bias at each reference value. For example, for a reference value that has an insignificant p-value at the 0.05 level, the 95% confidence interval on the plot does not necessarily include 0. Use the p-values to assess the statistical significance of the bias at a reference value.
Formula
The following formula gives the confidence bounds for the mean bias:

where  is the 1–α/2 quantile of the t-distribution with v degrees
of freedom for a two-sided interval.
is the 1–α/2 quantile of the t-distribution with v degrees
of freedom for a two-sided interval.
Notation
| Term | Description |
|---|---|
 | fitted bias |
 | quantile from the t distribution |
| v | degrees of freedom, n − 2 |
| SE | standard error of the mean bias |
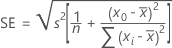
Standard error of the mean bias
Formulas
The standard error of the mean bias is:

Notation
| Term | Description |
|---|---|
 | mean square error |
| n | number of observations |
 | reference value |
 | mean of the reference values |
 | ith reference value |