A control chart indicates when your process is out of control and helps you identify the presence of special-cause variation. When special-cause variation is present, your process is not stable and corrective action is necessary.
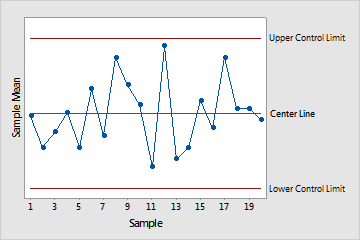
Control charts are graphs that plot your process data in time-ordered sequence. Most control charts include a center line, an upper control limit, and a lower control limit. The center line represents the process mean. The control limits represent the process variation. By default, the control limits are drawn at distances of 3σ above and below the center line.
Points that fall randomly within the control limits indicate that your process is in control and exhibits only common-cause variation. Points that fall outside the control limits or display a nonrandom pattern, indicate that your process is out of control and that special-cause variation is present.
When to use a control chart
Whether you are monitoring an ongoing process or trying to obtain more understanding of your new process, control charts can be helpful tools.
You can use control charts to:
Demonstrate whether your process is stable and consistent over time. A stable process is one that includes only common-cause variation and does not have any out-of-control points.
Verify that your process is stable before you perform a capability analysis. A capability analysis is only valid when performed on a stable process.
Assess the effectiveness of a process change. With control charts, it is easy to compare shifts in the process mean and changes in the process variation.
Communicate the performance of your process during a specific period of time.