Select the method or formula of your choice.
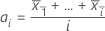
Plotted points
- when i
 v
v -
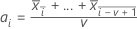
- when i > v
-
Notation
| Term | Description |
|---|---|
| v | number of sample means that are averaged |
| μ | process mean |
| k | parameter for Test 1. The default is 3. |
| σ | process standard deviation |
| ni | size of subgroup i |
Center line
The center line represents the process average. Minitab uses  to estimate μ.
to estimate μ.Control limits
Lower control limit (LCL)
- when

-

- when

-

Upper control limit (UCL)
- when

-

- when

-
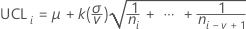
Notation
| Term | Description |
|---|---|
| ni | size of subgroup i |
| v | number of sample means that are averaged |
| μ | process mean |
| k | parameter for Test 1. The default is 3. |
| σ | process standard deviation |
Methods and formulas for Box-Cox
Box-Cox formula
If you use a Box-Cox transformation, Minitab transforms the original data values (Yi) according to the following formula:
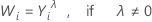
where λ is the parameter for the transformation. Minitab then creates a control chart of the transformed data values (Wi). To learn how Minitab chooses the optimal value for λ, go to Methods and formulas for Box-Cox Transformation.
Common λ values
The following table shows some commonly used λ values and their transformations.
| λ | Transformation |
|---|---|
| 2 |  |
| 0.5 |  |
| 0 |  |
| −0.5 |  |
| −1 |  |