In This Topic
Display additional σ limits at
In These multiples of the standard deviation, enter one or more values to display additional standard deviation lines on your control chart.
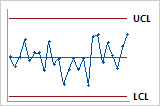
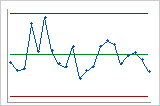
Default 3 sigma limits
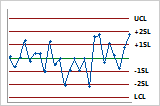
Additional sigma limits at 1 and 2 standard deviations
Place bounds on control limits
You can specify a lower bound and an upper bound for the control limits. If the calculated control limit is farther from the center line than the value that you specify, Minitab displays the bound instead of the control limit. Minitab labels the lower bound as LB and the upper bound as UB.
Note
Upper bounds and lower bounds do not affect the calculations for any of the tests for special causes.
Force control limits to be straight
CAUTION
When you specify a subgroup size, you change the calculations for the control limits, which can change the results of the tests for special causes. Use this option only if the differences between the subgroup sizes are small. Don't use this option when the difference between subgroup sizes is more than 25%. For example, if the largest subgroup has 10 observations and the smallest subgroup has 8 observations, then the difference is 20% ((10 – 8) / 10 = 0.2 = 20%).
For example, the data for the following charts is the same, but the control limits for the second chart were calculated based on a fixed subgroup size.
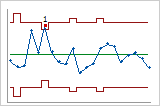
Actual subgroup sizes