In This Topic
- Available analyses for nonnormal data
- Use Automated Capability Analysis to select a method
- Example of using Automated Capability Analysis to select a method
- Use Individual Distribution Identification to find an appropriate distribution or transformation
- Example of using Individual Distribution Identification to compare fits of distributions and transformations
Available analyses for nonnormal data
- Select a nonnormal distribution model that fits your data and then analyze the data using a capability analysis for nonnormal data, such as Nonnormal Capability Analysis.
- Transform the data so that the normal distribution is an appropriate model, and use a capability analysis for normal data, such as Normal Capability Analysis.
- Select a nonparametric method that does not make assumptions about the distribution of the data, such as Nonparametric Capability Analysis.
- Use engineering or historical knowledge of your process.
- Most often, it is best to use engineering and historical knowledge of your process to identify a method that fits your process data. For example, does the data follow a symmetric distribution? What method has worked in the past for similar situations?
- Use goodness-of-fit assessments.
- The Anderson-Darling test assesses whether a given distribution fits data from a process. Probability plots are another tool that assess how closely data follow a distribution.
- Evaluate how different methods affect your conclusions.
- If several methods provide an adequate fit to the data and similar conclusions, then the choice is less consequential. Conversely, if your conclusions depend on the method, you may want to report the most conservative conclusion or collect more information. For example, you can use the distribution results from Automated Capability Analysis or the percentiles from Individual Distribution Identification to see how your conclusions depend on the method.
- If you plan to perform repeated capability analyses on your process over time, try to use a method that is likely to adequately characterize your process consistently over time. Using the same method lets you easily and directly compare the indices from the repeat analyses.
- Nonnormal and nonparametric models use the actual data units. The normal model from a transformation uses transformed units.
- The normal model from a transformation provides estimates of both overall and within process capability.
Use Automated Capability Analysis to have Minitab Statistical Software help to determine a reasonable method that fits the data, while considering the usefulness and practicality of the method. The analysis considers distributions first, then transformations. If no model fits the data, the analysis uses the nonparametric method.
To look at more detail about the data, use Individual Distribution Identification. The analysis provides goodness-of-fit measures for different methods to support your decision about which method to use.
Use Automated Capability Analysis to select a method
Use Automated Capability Analysis to assess the compatibility of several methods with the data and make a reasonable selection.
- Choose .
- Specify whether your data are arranged in a single column or across rows.
- Enter the specification limits for the process.
The analysis considers distributions, then transformations. If no parametric method fits the data, then the analysis uses the nonparametric method. The results include a capability report for the first method that provides a reasonable fit. The table of distribution results shows the order of the evaluation of the methods, information about the fit of the methods, and capability statistics. You can produce results for an alternative method to investigate the methods in more detail.
Example of using Automated Capability Analysis to select a method
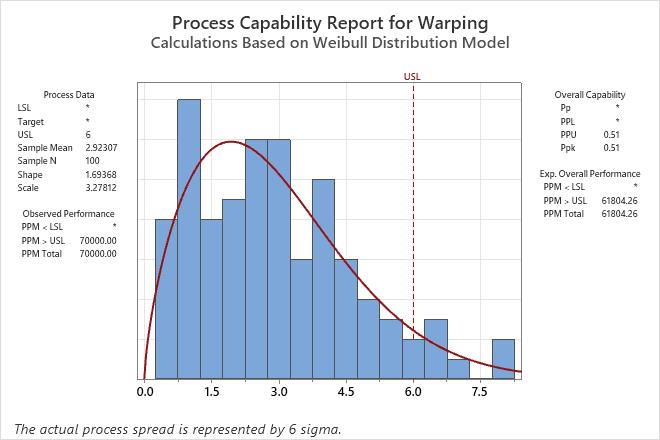
An engineer collects data on the extent of warping in ceramic tiles. The data distribution is unknown, so she performs Individual Distribution Identification on the data to determine a reasonable method for a capability analysis.
The table of distribution results shows the order of the evaluation of the methods. In the first row, the conclusion for the Anderson-Darling test is that the data do not follow a normal distribution at the 0.05 level of significance because the p-value is less than 0.05. In the second row, the conclusion for the Anderson-Darling test is that the Weibull distribution is a reasonable fit to the data because the p-value is greater than 0.05. The capability results are for the Weibull distribution because the Weibull distribution is the first method in the list that provides a reasonable fit.
The engineers use process knowledge to consider whether the Weibull distribution is a reasonable method. For example, the Weibull distribution has a boundary at 0. In the data, 0 is a boundary that represents an unwarped tile.
The analysis includes a capability analysis that uses the Weibull distribution.
Automated Capability Distribution Results: Warping
| Distribution | Location | Scale | Threshold | Shape | P | Ppk | Cpk |
|---|---|---|---|---|---|---|---|
| Normal | 2.9231 | 1.7860 | 0.0100421 | 0.5743 | 0.5838 | ||
| Weibull* | 3.2781 | 1.6937 | >0.25 | 0.5133 | |||
| Lognormal | 0.8443 | 0.7444 | <0.005 | 0.4242 | |||
| Smallest Extreme Value | 3.8641 | 1.9924 | <0.01 | 0.5362 | |||
| Largest Extreme Value | 2.0958 | 1.4196 | 0.212835 | 0.5130 | |||
| Gamma | 1.2477 | 2.3428 | 0.238337 | 0.4851 | |||
| Logistic | 2.7959 | 1.0162 | 0.0127347 | 0.5799 | |||
| Loglogistic | 0.9097 | 0.4217 | <0.005 | 0.4090 | |||
| Exponential | 2.9231 | <0.0025 | 0.3780 | ||||
| 3-Parameter Weibull | 2.9969 | 0.2099 | 1.5049 | 0.467097 | 0.4980 | ||
| 3-Parameter Lognormal | 1.3788 | 0.4184 | -1.4002 | 0.4961 | |||
| 3-Parameter Gamma | 1.2314 | -0.0197 | 2.3898 | 0.4864 | |||
| 3-Parameter Loglogistic | 1.3043 | 0.2700 | -1.0940 | 0.4656 | |||
| 2-Parameter Exponential | 2.6679 | 0.2552 | <0.01 | 0.3982 | |||
| Box-Cox transformation | 1.6237 | 0.5380 | 0.574337 | 0.5116 | 0.5214 | ||
| Johnson transformation | 0.0112 | 0.9949 | 0.798895 | 0.4959 | |||
| Nonparametric | 0.6187 |
Use Individual Distribution Identification to find an appropriate distribution or transformation
Use Individual Distribution Identification prior to performing a capability analysis to determine which distribution or transformation is most appropriate for your data. If no distribution or transformation is compatible with your data, consider Nonparametric Capability Analysis.
- Choose .
- Choose whether your data are arranged in a single column or across rows.
- Choose Use all distributions and transformations or Specify and choose up to 4 distributions and transformations to test.
- Nonnormal Capability Analysis
- Nonnormal Capability Analysis for Multiple Variables
- Nonnormal Capability Sixpack
- Normal Capability Analysis
- Normal Capability Sixpack
- Normal Capability Analysis for Multiple Variables
- Between/Within Capability Analysis
Example of using Individual Distribution Identification to compare fits of distributions and transformations
An engineer collects data on the extent of warping in ceramic tiles. The data distribution is unknown, so she performs Individual Distribution Identification on the data to compare goodness-of-fit between the exponential distribution and the normal distribution after a Johnson transformation.
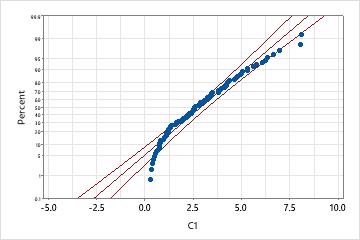
Exponential distribution
This probability plot indicates that the exponential distribution is not a good fit; the p-value is low enough to reject the null hypothesis that the data follow an exponential distribution.
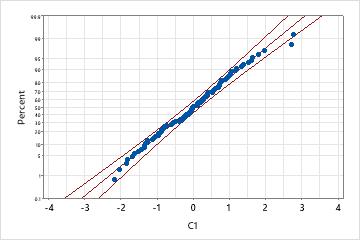
Normal distribution with Johnson transformation
However, after applying a Johnson transformation, the data closely follow a normal distribution because the p-value is large and almost all data points fall within the confidence bounds of the normal probability plot.