Use Parallel Coordinates Plot to visually compare many series or groups of series on parallel coordinates across multiple variables.
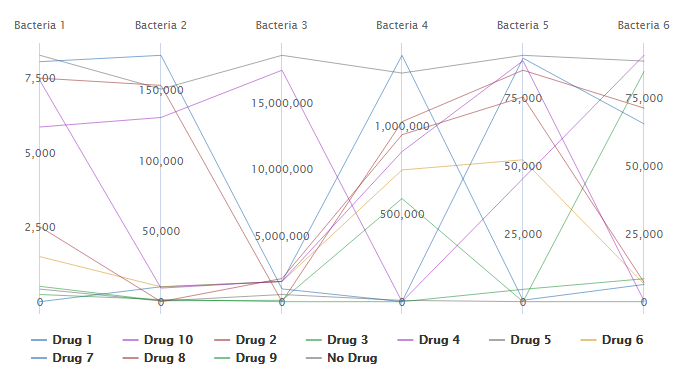
For example, a medical researcher creates a parallel coordinates plot to evaluate the effects that different drugs may have on the growth of various types of bacteria.
Where to find this graph
To create a parallel coordinates plot, choose .