A quality engineer wants to compare pistons from two suppliers. The engineer measures the lengths of a random sample of 100 pistons from each of the suppliers. The engineer creates a histogram with fit and groups to compare the distributions of the sample data.
- Open the sample data, PistonLength.MWX.
- Choose .
- In Graph variables, enter Length.
- In Categorical variables for grouping (0-3), enter Supplier.
- Click OK.
Interpret the results
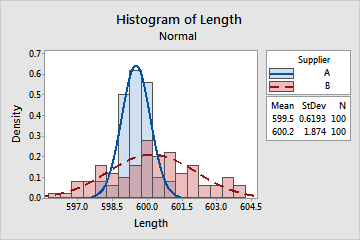
Supplier A's pistons appear to be shorter than Supplier B's pistons. This is indicated by the means in the table (599.5 and 600.2, respectively), as well as the relative position of the peaks for the fitted normal distributions. The standard deviation for Supplier B's sample (1.874) is much greater than that of Supplier A (0.6193). Thus, the fitted distribution for Supplier B is shorter and wider.
Note
For information on how to specify different distributions and parameters, go to Fitted distribution lines.