Cumulative line on a Pareto chart shows the sum of all the percentage values up to that category, as opposed to the individual percentages of each category.
About the cumulative line on a Pareto chart
The cumulative percentage line starts at the first (highest) bar, and extends to the last bar to help you assess the added contribution of each category. The cumulative percentage is also displayed for each bar under the chart unless you have a by variable and display all on one graph.
Key Results: Cum %
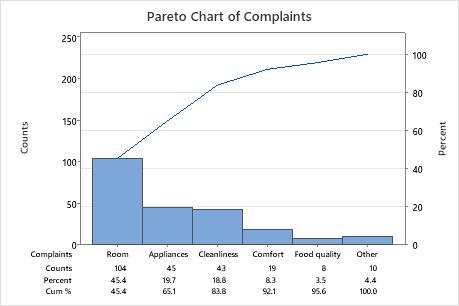
In these results, 65.1% of all the complaints are from the first two categories, Room and Appliances. Over 90% of all complaints are from the first 4 categories.
Edit a cumulative line
You can edit a cumulative line by changing the line type, line size, symbol type, symbol size, or the color of the lines and symbols.
- Double-click the graph.
- Double-click the cumulative line.
- Choose Custom.