You can change contour levels, areas, lines, and labels on a contour plot. You can edit contour lines on an overlaid contour plot that you get with a DOE analysis.
About contour levels, areas, lines, and labels
Contours on a contour plot represent response (z) values. By default, darker areas represent higher z-values. For example, the following plot shows how reheat time (y) and temperature (x) affect the quality (contours) of a frozen entree.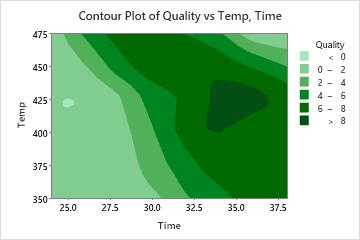
Edit contour levels
To edit the contour levels when you create a graph, click Contour Options. To edit the contour levels on an existing graph, use the following steps:
- Double-click the graph.
- Right-click the graph and choose Edit Area.
- On the Levels tab, select one of the following options:
- Automatic: Minitab determines the optimum levels.
- Number: Enter the number of levels to display.
- Values: Enter the boundaries of the levels to display.
Edit contour areas
To edit contour areas on an existing graph, use the following steps:
- Double-click the graph
- Right-click the graph and choose Edit Area.
- You can change the following options:
- Edit the contour colors
- On the Attributes tab, under Fill Color, indicate how to represent the different contour levels.
- Spectrum colors: Use many different colors.
- One-color ramp (default): Use shades of one color. Then, select the color.
- Two-color ramp: Use multiple shades of two different colors. Then, select the low-end color and the high-end color.
- Custom colors: Select a color for each of the contour areas.
- Edit the contour levels
- On the Levels tab, under Contour Levels, select one of the following:
- Automatic: Minitab determines the optimum levels.
- Number: Enter the number of levels to display.
- Values: Enter the boundaries of the levels to display.
Add and edit contour lines
To add contour lines when you create a graph, click Data View. To add contour lines to an existing graph, use the following steps:
- Double-click the graph.
- Select and double-click a contour line.
- You can change the following options:
- Edit the appearance of contour lines
- On the Attributes tab, under Contour Lines, select one of the following:
- Automatic: Minitab determines the contour line attributes.
- Solid black lines (default): All contour lines are solid black.
- Varying attributes: Each contour line has different attributes.
- Custom attributes: Select a type, color, and size for each contour line.
- Show or hide contour labels
- On the Contour Labels tab, choose one of the following:
- Automatic (default): Display contour labels if the plot does not have a legend. Minitab displays a legend if the plot has areas, varying line attributes, or custom line attributes.
- Show labels: Display contour labels.
- No labels: Hide contour labels.
- Edit contour label font
- On the Font tab, you can edit the font, style, size, and color of the contour label.
- Edit contour label background
- On the Font Background tab, you can edit the fill type, fill color, line type, and line color of the contour label background.
- Edit the contour levels
- On the Levels tab, under Contour Levels, select one of the following:
- Automatic: Minitab determines the optimum levels.
- Number: Specify the number of levels to display.
- Values: Specify the boundaries of the levels to display.
Note
For information on how to change the appearance of the mesh of the plot by using different methods to interpolate between values, go to Mesh.
Edit contour lines (overlaid contour plot, DOE)
To edit the contour lines on an overlaid contour plot that you get with a DOE analysis, use the following steps:
- Double-click the graph.
- Right-click the graph and choose .
- Select the tab to make the edits that you want.
- Contours: Define the low and high values for each response. For more information, go to Define the contour values for Contour Plot.
- Low-High Attributes: Change the line type and line size for the low contour line and the high contour line for each response.
- Response Variable Attributes: Change the color of the contour lines for each response.
- To change the color or the type of fill pattern for the nonfeasible region, right-click the graph in editing mode and choose Edit Area.