Use Boxplot to assess and compare the shape, central tendency, and variability of sample distributions, and to look for outliers. A boxplot works best when the sample size is at least 20. By default, a boxplot shows the median, interquartile range, range, and outliers for each group.
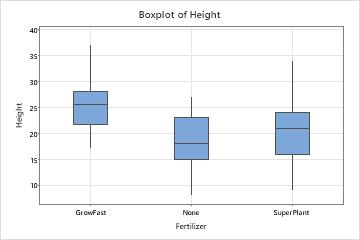
For example, a scientist creates a boxplot to compare the height of plants grown with two different fertilizers and a control group with no fertilizer.
Where to find this graph
To create a boxplot, choose .
When to use an alternate graph
If the sample size is less than 20, consider using an Individual value plot instead.