Select either
Y-scale,
X-scale,
or both to transform the corresponding scale. Minitab transforms the scale
using logarithm base 10.
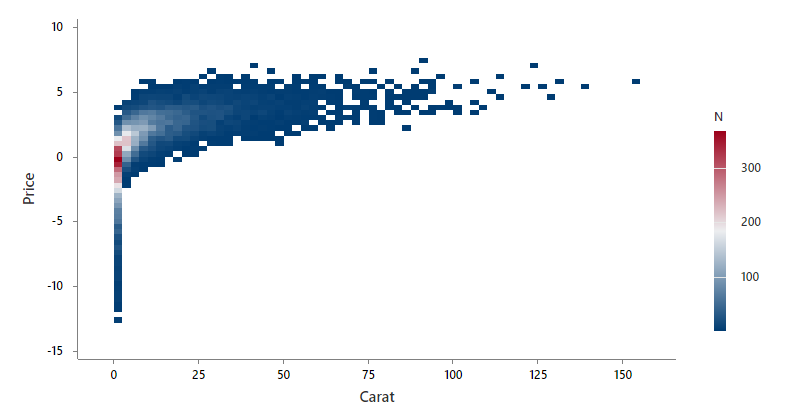
A logarithmic scale linearizes logarithmic relationships by changing the
axis, so that the same distance represents different changes in value across
the scale. For example, in the scatterplot with the untransformed x-scale, the
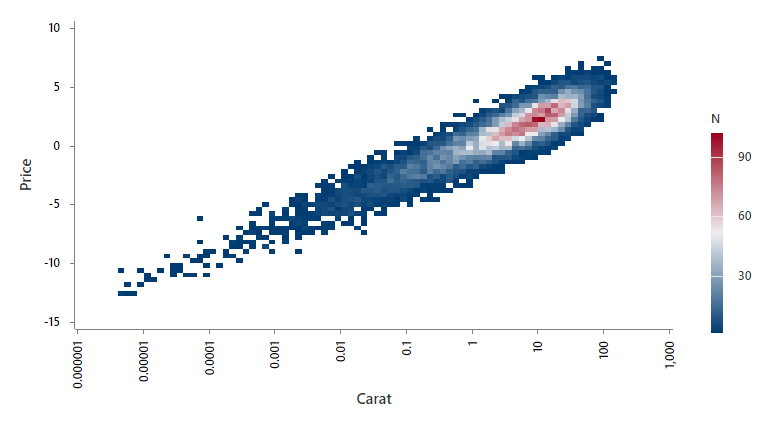
function y = log(x) is not linear. When you transform the x-scale to logarithm
base 10, the form of the data is linear.
Untransformed x-scale
Transformed x-scale (log base 10 transformation)
Gradient
type
Select the color scale for the bins.
Diverging
Bins with high values are red, and bins with low values are blue.
Sequential from
low to high
Bins with high values are dark blue, and bins with low values are light
blue and light gray. You can use this option to highlight bins with more
productivity or to maximize revenue.
Sequential from
high to low
Bins with low values are dark blue, and bins with high values are light
blue and light gray. You can use this option to highlight bins with low defect
rates or to minimize cost.
Gradient
symmetric around value (optional)
Enter a value to center the gradient scale at a specific value rather than
the center of the grouping variable or the frequency of the binned data. For
example, a research team selects the gradient to be defined by the mean of the
profit of all the products in the bin. The owner enters 0 as the
Gradient
symmetric around value (optional)
so that bins with products that made a positive profit are a different color
than those that lost money.
Note
This option is only available when you select
Diverging
from
Gradient
type.
Use same
gradient scale for all graphs
Use the same color gradient scale across all graphs. For the same pair of x
y-variables, the gradient scale will always be the same.