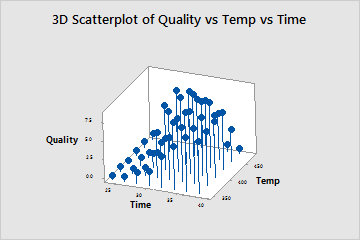
Use 3D Scatterplot to examine the relationship between a response variable (Z) and two predictor variables (X and Y), by viewing the data on three axes.
For example, the following 3D scatterplot shows the effect of temperature and time on the quality of reheated frozen entrees.
Where to find this graph
To create a 3D scatterplot, choose .