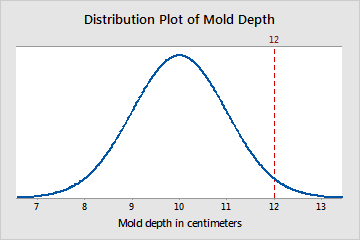
The Z-value is a test statistic for Z-tests that measures the difference between an observed statistic and its hypothesized population parameter in units of the standard deviation. For example, a selection of factory molds has a mean depth of 10cm and a standard deviation of 1 cm. A mold with a depth of 12 cm has a Z-value of 2, because its depth is two standard deviations greater than the mean. The vertical line represents this observation, and its location relative to the entire population:

Converting an observation to a Z-value is called standardization. To standardize an observation in a population, subtract the population mean from the observation of interest and divide the result by the population standard deviation. The result of these calculations is the Z-value associated with the observation of interest.
You can use the Z-value to determine whether to reject the null hypothesis. To determine whether to reject the null hypothesis compare the Z-value to your critical value, which can be found in a standard normal table in most statistics books. The critical value is Z1-α/2 for a two sided test and Z1-α for a one sided test. If the absolute value of the Z-value is greater than the critical value, you reject the null hypothesis. If it is not, you fail to reject the null hypothesis.
For example, you want to know whether a second group of molds also has a mean depth of 10cm. You measure the depth of each mold in the second group, and calculate the group's mean depth. A 1-sample Z-test calculates a Z-value of −1.03. You choose an α of 0.05, which results in a critical value of 1.96. Because the absolute value of the Z-value is less than 1.96, you fail to reject the null hypothesis and cannot conclude that the mold's mean depth is different from 10cm.
