Uses of the normal distribution to model reliability data
Industrial applications frequently generate data that are normally distributed. However, the normal distribution is not as commonly used to model reliability data as other distributions, partially because its left tail extends to negative infinity, which could cause incorrect modeling of negative times to failure. Most reliability data are modeled using distributions for positive random variables, such as exponential, Weibull, gamma, and lognormal. Therefore, fewer applications use the normal distribution as a model for product life. However, if the mean of the data is greater than 0 and its variation relatively low, the normal distribution can be useful for modeling certain types of life data. Notice that the normal distribution closely approximates the Weibull distribution when 3 < β < 4.
The normal distribution can sometimes be used to model the life of consumable items, in which the risk of failure is always increasing. Electric filament devices, such as incandescent light bulbs and toaster heating elements, are examples of items whose failure data may follow a normal distribution. The strength of a wire bond in integrated circuits is an additional example.
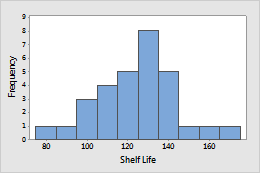
Example 1: Beverage shelf life
To evaluate the shelf life of beverages, analysts record the number of days before a bottled beverage discolors.
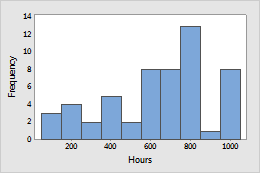
Example 2: Toaster reliability
Engineers conduct life tests on a toaster with a new component.
Probability density function and hazard function for the normal distribution
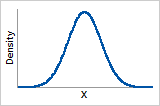
Probability density function
The probability density function for the normal distribution is symmetric and bell-shaped.
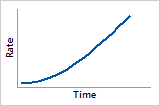
Hazard function
The hazard function for the normal distribution shows a strictly increasing risk of failure.