The node statistics come from the data for individual nodes. When you use a validation method, the fit for a node is the same whether it is in the test data set or the training data set. The other statistics use the records for the node from the training or test data set.
These statistics appear in the table of the best or worst terminal nodes. In general, rows are in order by the size of the error, either MSE or MAD. When both values are less than 1, values within 1E-12 are ties. When either error value is greater than 1, values within 1E-12*(larger value) are ties. Minitab sorts ties by their weighted counts. If the weighted counts are also ties, then Minitab sorts ties by the node ID.
Fit
The fit depends on the criterion for the improvement of a node. When the criterion is least squares, then the fit is the mean:

When the criterion is least absolute deviation, then the fit is the median.
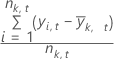
StDev
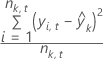
MSE
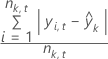
MAD
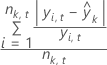
MAPE
Notation
| Term | Description |
|---|---|
 | fitted value for the kth node |
| yi | i th observed response value in the kth node |
 | mean response for the records in the kth node |
| nk | count of records in the kth node |
| nk, t | count of records in the kth node for observations in either the training data set or the test data set |
| yi, t | i th observed response value in the kth node for either the training data set or the test data set |
 | mean response for the records in the kth node in either the training data set or the test data set |