In This Topic
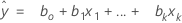
Fit
Notation
| Term | Description |
|---|---|
 | fitted value |
| xk | kth term. Each term can be a single predictor, a polynomial term, or an interaction term. |
| bk | estimate of kth regression coefficient |
Residuals

Notation
| Term | Description |
|---|---|
| yi | ith observed response value |
 | ith fitted value for the response |
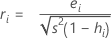
Standardized residual (Std Resid)
Standardized residuals are also called "internally Studentized residuals."
Formula
Notation
| Term | Description |
|---|---|
| ei | i th residual |
| hi | i th diagonal element of X(X'X)–1X' |
| s2 | mean square error |
| X | design matrix |
| X' | transpose of the design matrix |
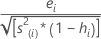
Deleted (Studentized) residuals
Also called the externally Studentized residuals. The formula is:
Another presentation of this formula is:
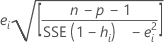
The model that estimates the ith observation omits the ith observation from the data set. Therefore, the ith observation cannot influence the estimate. Each deleted residual has a student's t-distribution with  degrees of freedom.
Notation
| Term | Description |
|---|---|
| ei | ith residual |
| s(i)2 | mean square error calculated without the ith observation |
| hi | i th diagonal element of X(X'X)–1X' |
| n | number of observations |
| p | number of terms, including the constant |
| SSE | sum of squares for error |
Whole plot residuals

Notation
| Term | Description |
|---|---|
 | fitted value for the full model (including the whole plot error term as well as fixed terms) |
 | fitted value using only the fixed effects terms, not the whole plot error term |
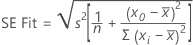
Standard error of fitted value (SE Fit)
The standard error of the fitted value in a regression model with one predictor is:
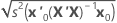
The standard error of the fitted value in a regression model with more than one predictor is:
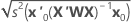
For weighted regression, include the weight matrix in the equation:
When the data have a test data set or K-fold cross validation, the formulas are the same. The value of s2 is from the training data. The design matrix and the weight matrix are also from the training data.
Notation
| Term | Description |
|---|---|
| s2 | mean square error |
| n | number of observations |
| x0 | new value of the predictor |
 | mean of the predictor |
| xi | ith predictor value |
| x0 | vector of values that produce the fitted values, one for each column in the design matrix, beginning with a 1 for the constant term |
| x'0 | transpose of the new vector of predictor values |
| X | design matrix |
| W | weight matrix |
Standard error of fitted values (SE fit) for a split-plot design


Notation
| Term | Description |
|---|---|
 | subplot variance component, calculated as MSE(SP) |
| X | n × p design matrix for effects of factors, covariates, blocks, and the whole plot error term |
 | the whole plot variance component, which in a balanced design has this formula:  |
| m | the number of subplots within a whole plot |
| Z | n × w matrix of whole plot indicators (all 1's and 0's) |
| n | number of rows of data |
| p | number of coefficients |
| w | number of whole plots |
| x | row vector of predictor levels |
 | covariance matrix of β |
| β | vector of coefficients |
Confidence interval
The range in which the estimated mean response for a given set of predictor values is expected to fall.
Formula

Notation
| Term | Description |
|---|---|
 |  |
 | fitted response value for a given set of predictor values |
| α | type I error rate |
| n | number of observations |
| p | number of model parameters |
| S 2(b) | variance-covariance matrix of the coefficients |
| s 2 | mean square error |
| X | design matrix |
| X0 | vector of given predictor values with 1 column and p rows |
| X'0 | transpose of the new vector of predictor values with 1 row and p columns |
Prediction interval
The prediction interval is the range in which the fitted response for a new observation is expected to fall.
Formula

Notation
| Term | Description |
|---|---|
| s(Pred) |  |
 | fitted response value for a given set of predictor values |
| α | level of significance |
| n | number of observations |
| p | number of model parameters |
| s 2 | mean square error |
| X | predictor matrix |
| X0 | vector of given predictor values with 1 column and p rows |
| X'0 | transpose of the new vector of predictor values with 1 row and p columns |