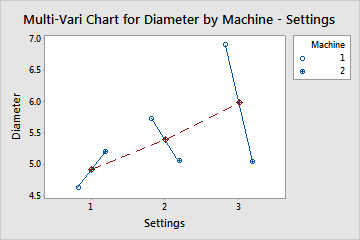
Use Multi-Vari Chart as a preliminary tool to investigate variation in your data, including cyclical variations and interactions between factors. A multi-vari chart provides a graphical representation of the relationships between factors and a response.
The multi-vari chart displays the means at each factor level for every factor. In Minitab, each multi-vari chart can display up to four factors.
Where to find this analysis
To create multi-vari charts, choose .
When to use an alternate analysis
To test the statistical significance of the factors or the interactions, you can use an ANOVA (analysis of variance) or a regression analysis. Use Variability Chart when you have more than four factors or when you want to examine an average response with variation chart and a standard deviation chart.