An engineer wants to monitor the impact strength of ceramic components. The engineer randomly selects 30 components that represent the expected range of the process variation. Each component is large enough to yield 2 samples of the correct size for the test. The engineer prepares the samples from the components and assigns the same part number to samples from the same component. The operator randomly selects 10 parts for each of 3 operators to measure. The 3 operators measure the strength of each sample, two samples per part, for a total of 60 measurements.
Because the measurements are nested within operator, the engineer performs a nested gage R&R study to assess the variability in measurements that may be due to the measurement system.
- Open the sample data, CeramicComponent.MWX.
- Choose .
- In Part or batch numbers, enter Part.
- In Operators, enter Operator.
- In Measurement data, enter Response.
- Click OK.
Interpret the results
In the ANOVA table, the p-value for Operator is 0.773. Because the p-value is large, the engineer fails to reject the null hypothesis and concludes that the average strength measurement probably does not depend on which operator takes the measurements. However, the p-value for Part (Operator) is 0.000 and is less than 0.05. The average measurements of different parts nested within each operator are significantly different.
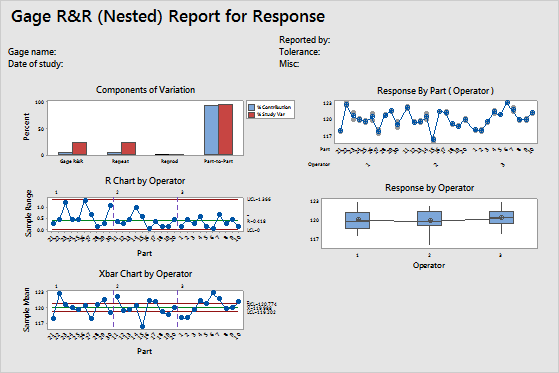
Use %Study Var to compare the measurement system variation to the total variation. The Total Gage R&R equals 23.71% of the study variation, and the Part–to–Part variation equals 97.15%. The Total Gage R&R variation might be acceptable depending on the application. For more information, go to Is my measurement system acceptable?.
Also, this measurement system can distinguish 5 distinct categories. This result indicates that the measurement system can distinguish between parts. According to the AIAG, you need at least 5 distinct categories to have an adequate measuring system. For more information, go to Using the number of distinct categories in a gage R&R study.
- In the Components of Variation graph, most of the variability is explained by the Part–to–Part variation.
- In the R Chart by Operator, all the data are in control, which indicates that the three operators measure consistently.
- In the Xbar Chart by Operator, several points are beyond the control limits. Thus, much of the variation is due to differences between parts.
- The By Part graph shows that the differences between parts are large.
- In the By Operator graph, the measurements for each operator vary by approximately the same amount. Also, the part averages vary by a small amount. While some variation is always present, the data indicate that the operators measure parts similarly.
Variance Components
| Source | VarComp | %Contribution (of VarComp) |
|---|---|---|
| Total Gage R&R | 0.14601 | 5.62 |
| Repeatability | 0.14601 | 5.62 |
| Reproducibility | 0.00000 | 0.00 |
| Part-To-Part | 2.45079 | 94.38 |
| Total Variation | 2.59679 | 100.00 |
Gage Evaluation
| Source | StdDev (SD) | Study Var (6 × SD) | %Study Var (%SV) |
|---|---|---|---|
| Total Gage R&R | 0.38211 | 2.29265 | 23.71 |
| Repeatability | 0.38211 | 2.29265 | 23.71 |
| Reproducibility | 0.00000 | 0.00000 | 0.00 |
| Part-To-Part | 1.56550 | 9.39300 | 97.15 |
| Total Variation | 1.61146 | 9.66874 | 100.00 |