In This Topic
Bias versus reference plot
Use the Bias versus Reference Value plot to see how the bias values vary for each part. The blue dots represent the bias values for each reference value. The red square represents the average bias value for each reference value. The line is the least squares regression line fit to the average of the deviations.
Interpretation
Ideally, the deviations for each part are close to 0 and the fitted line is horizontal.
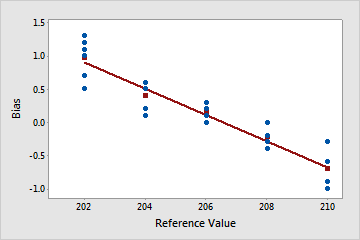
Linearity appears to be a problem
The plotted line is sloped. In this example, measurements for smaller parts are higher than their corresponding reference part values. Measurements for larger parts tend to be lower than their corresponding reference part values.
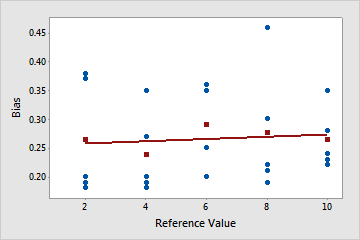
Linearity does not appear to be a problem
The plotted line is close to horizontal, which indicates that the average bias is relatively constant and does not depend on the reference value. In this example, the measurements for all parts are higher than their corresponding reference part measurements.
Coef
The coefficients are numbers from the regression line of the Bias versus Reference Value plot.
The general form of this least squares regression line is:

The term, b, represents the constant coefficient. It indicates where the fitted line crosses the y-axis.
The term, a, represents the slope coefficient. The slope of a line indicates the steepness of the line and is the change in the y-axis over the change in the x-axis.
Interpretation
When the slope coefficient, a, is very small, the slope is near horizontal. Thus, bias is relatively constant across reference values, and linearity is not a significant problem. Larger absolute values of the slope coefficient, |a|, indicate a steeper slope of the line. If the p-value of the slope is less than alpha, then linearity is significant.
In the absence of significant linearity, larger absolute values of the constant coefficient, |b|, indicate larger bias. When significant linearity is present, you must look at the individual bias values.
SE Coef
The standard error of the estimate of a regression coefficient measures how precisely the model estimates the coefficient's unknown value. The standard error of the coefficient is always positive.
Interpretation
Use the standard error of the coefficient to measure the precision of the estimate of the coefficient. The smaller the standard error, the more precise the estimate. Dividing the coefficient by its standard error calculates a t-value. If the p-value associated with the t-value is less than your α-level, you conclude that the coefficient is significantly different from 0.
p-value for Gage Linearity
- P for Constant: Use this to test whether the constant of the linearity line is equal to 0.
- P for Slope: Use this to test whether the slope of the linearity line is equal to 0.
Interpretation
- For the constant, if the p-value is greater than the α-value, you fail to reject the null hypothesis and conclude that the bias for all reference values is equal to 0.
- For the slope, if the p-value is greater than the α-value, you fail to reject the null hypothesis and conclude that the measurement system has the same bias for all reference values (linearity is not present).
- For the constant, if the p-value is less than the α-value, you reject the null hypothesis and conclude that the bias for all reference values is not equal to 0.
- For the slope, if the p-value is less than the α-value, you reject the null hypothesis and conclude that the measurement system does not have the same bias for all reference values (linearity is present).
S and R-Sq
S and R-Sq (R2) are measures of how well the model fits the data.
S is an estimate of σ, the standard deviation around the regression line.
R-Sq (R2) represents the proportion of variation in the bias that is explained by the linear relationship between the biases and the reference values.
Interpretation
Smaller values of S indicate less variability in the bias estimates. R2 ranges from 0 to 100%. Usually, the higher the R2 value, the better the model fits your data.
Linearity, %Linearity
Linearity assesses the difference in average bias through the expected operating range of the measurement system. Linearity indicates whether your gage has the same accuracy (the same bias) across all reference values.
%Linearity is the linearity expressed as a percentage of the process variation.
Interpretation
To interpret the linearity of your data, determine whether the bias changes across the reference values. If the data do not form a horizontal line on a scatterplot, linearity is present. Ideally, the fitted line will be horizontal and will be close to 0.
Linearity appears to be a problem
The plotted line is sloped. In this example, measurements for smaller parts are higher than their corresponding reference part values. Measurements for larger parts tend to be lower than their corresponding reference part values.
Linearity does not appear to be a problem
The plotted line is close to horizontal, which indicates that the average bias is relatively constant and does not depend on the reference value. In this example, the measurements for all parts are higher than their corresponding reference part measurements.
For a gage that measures consistently across parts, the %linearity will be close to 0.
Bias, %Bias
Bias is calculated as the difference between the known standard value of a reference part and the observed average measurement.The bias is a measure of a measurement system's accuracy.
%Bias is the bias expressed as a percentage of the process variability.
Interpretation
- A positive bias indicates that the gage measures high.
- A negative bias indicates that the gage measures low.
For a gage that measures accurately, the %bias is small.
p-value for Gage Bias
- P for Average Bias: Use this to test whether average bias is equal to 0.
- P for each reference value: Use this to test whether the bias is equal to 0 at each reference value.
Interpretation
- For each reference value, if the p-value is greater than the α-value, you fail to reject the null hypothesis and conclude that the bias is equal to 0.
- For the average bias, if the p-value is greater than the α-value, you reject the null hypothesis and conclude that the average bias is equal to 0.
- For each reference value, if the p-value is less than the α-value, you reject the null hypothesis and conclude that the bias is not equal to 0.
- For the average bias, if the p-value is less than the α-value, you reject the null hypothesis and conclude that the average bias is not equal to 0.