In This Topic
Step 1: Assess whether bias is present in the measurement system
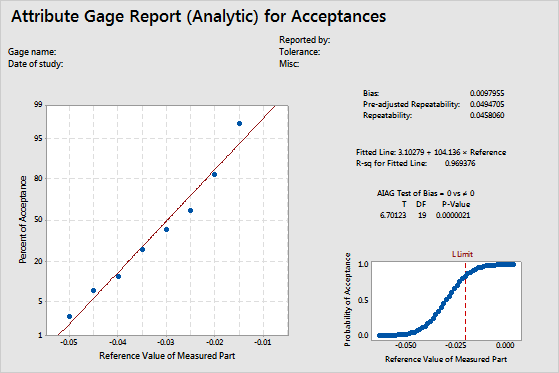
The bias is a measure of a measurement system's accuracy. Bias is calculated as the difference between the known standard value of a reference part and the observed average measurement. A low bias value indicates that the attribute gage measures parts close to their reference values.
To determine whether bias in the measurement system is statistically significant, compare the p-value to the significance level. Usually, a significance level (denoted as α or alpha) of 0.05 works well. A significance level of 0.05 indicates a 5% risk of concluding that bias exists when there is no significant bias.
Key Result: P-Value
For this example, bias is 0.0097955, and the p-value is 0.0000021. Because the p-value is less than the significance level of 0.05, you reject the null hypothesis that bias equals 0. You conclude that the bias in this measurement system is statistically significant.
Note
If you change the default setting to use the regression method instead of the AIAG method, the p-value may slightly differ.
Step 2: Assess the fitted line plot
The normal probability plot shows the percent of acceptances for each reference value. Because no actual measurements from the gage are available to estimate bias and repeatability, Minitab calculates bias and repeatability by fitting the normal distribution curve using the calculated probabilities of acceptance and the known reference values for all parts.
If the measurement errors follow a normal distribution, the calculated probabilities fall along a straight line. A regression line is fit to the probabilities.
The R-sq (R2) value for the fitted regression line indicates the percentage of the variation in the probability of acceptance responses that is explained by the regression model. R2 ranges from 0 to 100%. Usually, the higher the R2 value, the better the model fits your data. R2 values that are greater than 90% usually indicate a very good fit of the data.
Key Result: R-sq
For this example, R-sq is 0.969376. The fitted line fits the data very well, and the model accounts for almost 97% of the variance.
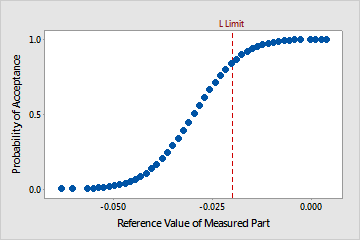
Step 3: Assess the gage performance curve
The gage performance curve shows the estimated probability of acceptance as a function of the reference value for the item. The vertical reference line indicates the limit(s) you entered for the analysis.
For this data, the probability of accepting an item at the lower tolerance limit of –0.020 is relatively high (approximately 0.84). However, the acceptance rate is also relatively high at values just below the tolerance limit. If the lower tolerance limit is critical, then some improvement is necessary.