Fabric appraisers at a textile printing company rate the print quality of cotton fabric on a 1 to 5 point scale. The quality engineer wants to assess the consistency and correctness of the appraisers' ratings. The engineer asks four appraisers to rate print quality on 50 samples of fabric twice, in random order.
Because the data include a known standard for each sample, the quality engineer can assess the consistency and correctness of ratings compared to the standard as well as compared to other appraisers.
- Open the sample data, TextilePrintQuality.MWX.
- Choose .
- In Data are arranged as, select Attribute column and enter Response.
- In Samples, enter Sample.
- In Appraisers, enter Appraiser.
- In Known standard/attribute, enter Standard.
- Select Categories of the attribute data are ordered.
- Click OK.
Interpret the results
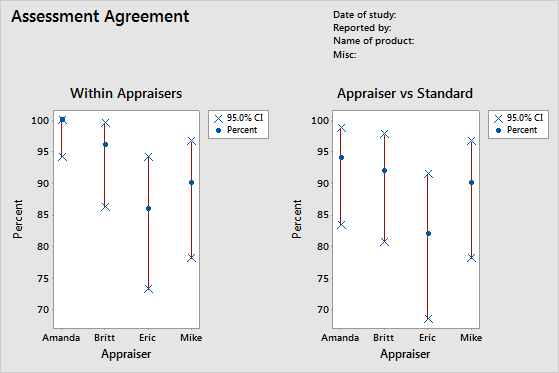
- Within Appraisers table
- Because each appraiser provides two or more ratings for each sample, the engineer can evaluate the consistency of each appraiser.
- Each Appraiser vs Standard table
- Because there is a known standard for each sample, the engineer can evaluate the accuracy and consistency of each of the appraiser's ratings.
- Between Appraisers table
- The Between Appraisers table shows that the appraisers agree on their ratings for 37 of the 50 samples.
- All Appraisers vs Standard table
- Because there is a known standard for each sample, the engineer can evaluate the accuracy of all the appraisers' ratings.
Note
The p-value of 0.0000 in the output is rounded. But you can safely conclude that the p-value is very low and is < 0.00005.
Assessment Agreement
| Appraiser | # Inspected | # Matched | Percent | 95% CI |
|---|---|---|---|---|
| Amanda | 50 | 50 | 100.00 | (94.18, 100.00) |
| Britt | 50 | 48 | 96.00 | (86.29, 99.51) |
| Eric | 50 | 43 | 86.00 | (73.26, 94.18) |
| Mike | 50 | 45 | 90.00 | (78.19, 96.67) |
Fleiss’ Kappa Statistics
| Appraiser | Response | Kappa | SE Kappa | Z | P(vs > 0) |
|---|---|---|---|---|---|
| Amanda | 1 | 1.00000 | 0.141421 | 7.0711 | 0.0000 |
| 2 | 1.00000 | 0.141421 | 7.0711 | 0.0000 | |
| 3 | 1.00000 | 0.141421 | 7.0711 | 0.0000 | |
| 4 | 1.00000 | 0.141421 | 7.0711 | 0.0000 | |
| 5 | 1.00000 | 0.141421 | 7.0711 | 0.0000 | |
| Overall | 1.00000 | 0.071052 | 14.0741 | 0.0000 | |
| Britt | 1 | 1.00000 | 0.141421 | 7.0711 | 0.0000 |
| 2 | 0.89605 | 0.141421 | 6.3360 | 0.0000 | |
| 3 | 0.86450 | 0.141421 | 6.1129 | 0.0000 | |
| 4 | 1.00000 | 0.141421 | 7.0711 | 0.0000 | |
| 5 | 1.00000 | 0.141421 | 7.0711 | 0.0000 | |
| Overall | 0.94965 | 0.071401 | 13.3002 | 0.0000 | |
| Eric | 1 | 0.83060 | 0.141421 | 5.8733 | 0.0000 |
| 2 | 0.84000 | 0.141421 | 5.9397 | 0.0000 | |
| 3 | 0.70238 | 0.141421 | 4.9666 | 0.0000 | |
| 4 | 0.70238 | 0.141421 | 4.9666 | 0.0000 | |
| 5 | 1.00000 | 0.141421 | 7.0711 | 0.0000 | |
| Overall | 0.82354 | 0.071591 | 11.5034 | 0.0000 | |
| Mike | 1 | 1.00000 | 0.141421 | 7.0711 | 0.0000 |
| 2 | 0.83060 | 0.141421 | 5.8733 | 0.0000 | |
| 3 | 0.81917 | 0.141421 | 5.7924 | 0.0000 | |
| 4 | 0.86450 | 0.141421 | 6.1129 | 0.0000 | |
| 5 | 0.86450 | 0.141421 | 6.1129 | 0.0000 | |
| Overall | 0.87472 | 0.070945 | 12.3295 | 0.0000 |
Kendall’s Coefficient of Concordance
| Appraiser | Coef | Chi - Sq | DF | P |
|---|---|---|---|---|
| Amanda | 1.00000 | 98.0000 | 49 | 0.0000 |
| Britt | 0.99448 | 97.4587 | 49 | 0.0000 |
| Eric | 0.98446 | 96.4769 | 49 | 0.0001 |
| Mike | 0.98700 | 96.7256 | 49 | 0.0001 |
Assessment Agreement
| Appraiser | # Inspected | # Matched | Percent | 95% CI |
|---|---|---|---|---|
| Amanda | 50 | 47 | 94.00 | (83.45, 98.75) |
| Britt | 50 | 46 | 92.00 | (80.77, 97.78) |
| Eric | 50 | 41 | 82.00 | (68.56, 91.42) |
| Mike | 50 | 45 | 90.00 | (78.19, 96.67) |
Fleiss’ Kappa Statistics
| Appraiser | Response | Kappa | SE Kappa | Z | P(vs > 0) |
|---|---|---|---|---|---|
| Amanda | 1 | 1.00000 | 0.100000 | 10.0000 | 0.0000 |
| 2 | 0.83060 | 0.100000 | 8.3060 | 0.0000 | |
| 3 | 0.81917 | 0.100000 | 8.1917 | 0.0000 | |
| 4 | 1.00000 | 0.100000 | 10.0000 | 0.0000 | |
| 5 | 1.00000 | 0.100000 | 10.0000 | 0.0000 | |
| Overall | 0.92476 | 0.050257 | 18.4006 | 0.0000 | |
| Britt | 1 | 1.00000 | 0.100000 | 10.0000 | 0.0000 |
| 2 | 0.83838 | 0.100000 | 8.3838 | 0.0000 | |
| 3 | 0.80725 | 0.100000 | 8.0725 | 0.0000 | |
| 4 | 1.00000 | 0.100000 | 10.0000 | 0.0000 | |
| 5 | 1.00000 | 0.100000 | 10.0000 | 0.0000 | |
| Overall | 0.92462 | 0.050396 | 18.3473 | 0.0000 | |
| Eric | 1 | 0.91159 | 0.100000 | 9.1159 | 0.0000 |
| 2 | 0.81035 | 0.100000 | 8.1035 | 0.0000 | |
| 3 | 0.72619 | 0.100000 | 7.2619 | 0.0000 | |
| 4 | 0.84919 | 0.100000 | 8.4919 | 0.0000 | |
| 5 | 1.00000 | 0.100000 | 10.0000 | 0.0000 | |
| Overall | 0.86163 | 0.050500 | 17.0622 | 0.0000 | |
| Mike | 1 | 1.00000 | 0.100000 | 10.0000 | 0.0000 |
| 2 | 0.91694 | 0.100000 | 9.1694 | 0.0000 | |
| 3 | 0.90736 | 0.100000 | 9.0736 | 0.0000 | |
| 4 | 0.92913 | 0.100000 | 9.2913 | 0.0000 | |
| 5 | 0.93502 | 0.100000 | 9.3502 | 0.0000 | |
| Overall | 0.93732 | 0.050211 | 18.6674 | 0.0000 |
Kendall’s Correlation Coefficient
| Appraiser | Coef | SE Coef | Z | P |
|---|---|---|---|---|
| Amanda | 0.967386 | 0.0690066 | 14.0128 | 0.0000 |
| Britt | 0.967835 | 0.0690066 | 14.0193 | 0.0000 |
| Eric | 0.951863 | 0.0690066 | 13.7879 | 0.0000 |
| Mike | 0.975168 | 0.0690066 | 14.1256 | 0.0000 |
Assessment Agreement
| # Inspected | # Matched | Percent | 95% CI |
|---|---|---|---|
| 50 | 37 | 74.00 | (59.66, 85.37) |
Fleiss’ Kappa Statistics
| Response | Kappa | SE Kappa | Z | P(vs > 0) |
|---|---|---|---|---|
| 1 | 0.954392 | 0.0267261 | 35.7101 | 0.0000 |
| 2 | 0.827694 | 0.0267261 | 30.9695 | 0.0000 |
| 3 | 0.772541 | 0.0267261 | 28.9058 | 0.0000 |
| 4 | 0.891127 | 0.0267261 | 33.3429 | 0.0000 |
| 5 | 0.968148 | 0.0267261 | 36.2248 | 0.0000 |
| Overall | 0.881705 | 0.0134362 | 65.6218 | 0.0000 |
Kendall’s Coefficient of Concordance
| Coef | Chi - Sq | DF | P |
|---|---|---|---|
| 0.976681 | 382.859 | 49 | 0.0000 |
Assessment Agreement
| # Inspected | # Matched | Percent | 95% CI |
|---|---|---|---|
| 50 | 37 | 74.00 | (59.66, 85.37) |
Fleiss’ Kappa Statistics
| Response | Kappa | SE Kappa | Z | P(vs > 0) |
|---|---|---|---|---|
| 1 | 0.977897 | 0.0500000 | 19.5579 | 0.0000 |
| 2 | 0.849068 | 0.0500000 | 16.9814 | 0.0000 |
| 3 | 0.814992 | 0.0500000 | 16.2998 | 0.0000 |
| 4 | 0.944580 | 0.0500000 | 18.8916 | 0.0000 |
| 5 | 0.983756 | 0.0500000 | 19.6751 | 0.0000 |
| Overall | 0.912082 | 0.0251705 | 36.2362 | 0.0000 |
Kendall’s Correlation Coefficient
| Coef | SE Coef | Z | P |
|---|---|---|---|
| 0.965563 | 0.0345033 | 27.9817 | 0.0000 |