- For the Box-Cox transformation, a λ value of 1 is equivalent to using the original data. Therefore, if the confidence interval for the optimal λ includes 1, then no transformation is necessary.
- If the confidence interval for λ does not include 1, a transformation is appropriate.
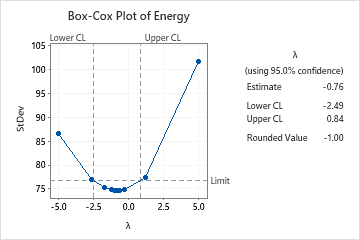
By default, Minitab estimates the optimal value of λ from your data and displays a plot. The x-axis of the plot represents λ values for a transformation of the data. The y-axis represents the estimated standard deviation of the transformed values, after they are standardized. For more information, go to Methods and formulas.
Typically, you want to use a value for λ that corresponds to an understandable transformation, such as the square root (λ = 0.5) or the natural log (λ = 0). If an appropriate rounded value falls within the confidence limits, then Minitab reports the rounded value.
In this example, the 95% confidence interval for λ (−2.49 to 0.84) does not include 1, so a transformation is appropriate. The estimated value for the optimal λ is −0.76. However, the rounded value of −1 is within the confidence interval. You can transform the data using λ = −1, which corresponds to the inverse transformation (transformed value = 1 / original value).