About graph layouts
Use a graph layout to organize multiple graphs from the same project. For
example, use to compare or contrast different graphs or emphasize a group of
graphs for a report or presentation.
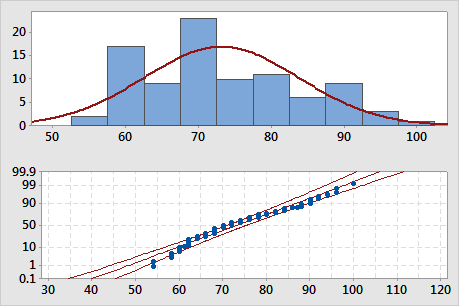
- 2 rows x 1 column
-
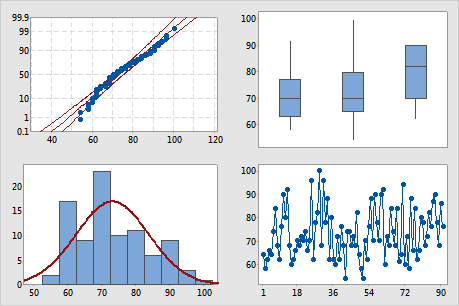
- 2 rows x 2 columns
-
Create a graph layout
- Create the graphs that you want.
-
Right-click a graph and choose
Layout Tool.
The active graph is copied to the first cell in the layout.
- In Rows, enter the number of rows for the layout.
- In Columns, enter the number of columns for the layout.
-
To copy graphs to the layout, click the cell where you want to copy
the graph and do one of the following:
- In the list box, double-click a graph name.
- In the list box,
click a graph name and then click the right arrow button
 .
.
- Double-click the image of the selected item below the list box.
- Click Finish.
Note
The graph region color of the first graph you add determines the graph region color for the entire layout.
Edit a graph layout
After you create a layout, you can add graphs to or remove graphs from the layout.
Right click the graph layout and choose
Layout Tool.
- To copy graphs to or remove graphs from the layout, use the arrow buttons.
- To move a graph within a layout, drag the graph to the new location.
Note
If the worksheet data changes after you create a layout, you cannot update the graphs in the layout to display the changes. You must re-create the layout with updated copies of the graphs.