A subset is a portion of the data in the worksheet. Some Minitab functions,
including many graphs and charts, let you define a subset of data so you can
work with it in isolation without changing the data in the worksheet itself.
For example, your worksheet may contain data for the entire year, but you want
to create a time series plot of only the previous six months. Using the subset
option lets you graph only those data points that came after your specified
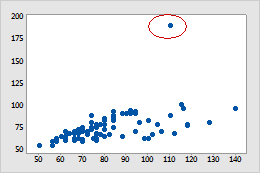
date. If data contain outliers, you can omit these potentially distracting
points from your graph without deleting them.
Scatterplot with outlier
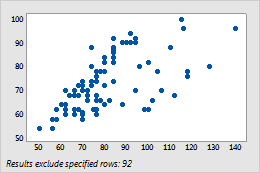
Scatterplot with outlier excluded
Note
Minitab automatically rescales the graph based on the subset of data
points you specified.
Graph a subset of the data when creating a graph
When you create a graph, you can specify a subset of data to graph.
In the graph creation dialog box, click
Data Options.
On the
Subset
tab, specify whether to include or exclude rows from the graph.
Specify which rows to include or exclude:
Rows that match a condition
Include or exclude rows that match the condition that you
specify. Click
Condition
and enter the formula. For example, if C1 contains dates and you want to
exclude rows that contain dates between 1/3/2016 and 1/7/2016, enter
C1>Date("1/3/2016") and
C1<Date("1/7/2016"). For more information, go to
Create a formula with the Calculator.
Brushed rows
Include or exclude rows that are currently brushed (usually
outliers).
Row numbers
Enter the row numbers to include or exclude. Use a colon (:) to
denote an inclusive range. For example, enter
1 4 6:10 to signify the rows 1, 4, 6, 7, 8,
9, 10. Use a slash (/) to denote increments. For example, enter
1:30/2 to signify all the odd number rows
from 1 to 29.
(For time series plots and control charts only) To leave a space in
the graph for the points that you exclude, select
Leave gaps for excluded points.
For control charts, Minitab treats the excluded points as
missing values in the calculations for control limits. If you don't select this
option, then Minitab omits the rows that contain excluded points from the
calculations for control limits.
Example of graphing a subset of data on a time series plot
You have the following data in a worksheet and you would
like to create a time series plot that includes only the data from 1/2/2014 to
1/7/2014 on the time series plot.
C1
C2
Date
Data
1/1/2014
5
1/2/2014
6
1/3/2014
9
1/4/2014
8
1/5/2014
7
1/6/2014
8
1/7/2014
9
1/8/2014
10
1/9/2014
11
Choose
Graph > Time Series Plot > Simple.
In
Series,
enter
C2.
Click
Data Options.
Under
Include or Exclude,
choose
Specify which rows to include.
Under
Specify Which Rows to Include,
choose
Rows that match
and click
Condition.
In
Condition,
enter
C1>=Date("1/2/2014") and
C1<=Date("1/7/2014").