Fisher's exact test
Fisher's exact test is a test of independence. The test is based on an exact distribution rather than on the approximate chi-square distribution used for the Pearson's and likelihood ratio tests. Fishers exact test is useful when the expected cell counts are low and the chi-square approximation is not very good.
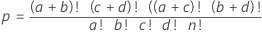
Formula
- population size
- total number of observations
- number of successes in the population
- number of observations in the first row
- sample size
- number of observations in the first column
Example
| Child | Adult | Row Total | |
|---|---|---|---|
| Sugar | 9 | 1 | 10 |
| Chocolate Chip | 2 | 8 | 10 |
| Column Total | 11 | 9 | 20 |
| Child | Adult | Row Total | |
|---|---|---|---|
| Sugar | a | b | a+b |
| Chocolate Chip | c | d | c+d |
| Column Total | a+c | b+d | a+b+c+d |

For this example, the sum of the p-values that are less than or equal to the pcutoff for the other possible matrices is 0.0054775.
McNemar's exact test
McNemar's test compares proportions that are observed before and after a treatment. For example, you can use McNemar's test to determine whether a training program changes the proportion of participants who correctly answer a question.
Observations for McNemar's test can be summarized in a two-by-two table, as shown below.
| After Treatment | |||
| Before Treatment | Condition True | Condition Not True | Total |
| Condition True | n11 | n12 | n1. |
| Condition Not True | n21 | n22 | n2. |
| Total | n·1 | n·2 | n·· |
The condition for the training example is a correct answer. Thus, n21 represents the number of participants who answer the question correctly after training but not before training. And n12 represents the number of participants who answer the question correctly before training but not after training. The total number of participants is represented by n...
Estimated difference
Let δ be the difference between the marginal probabilities, p1.- p.1, in the population. The estimated difference,  , is given by the following formula:

Confidence interval
An approximate 100(1 – α)% confidence interval is given by the following formula:
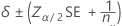
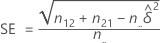
where α is the significance level for the test, z α/2 is the z-score associated with a tail probability of α/2, and SE is given by the following formula:
P-value
The null hypothesis is δ = 0. The exact p-value for the test of the null hypothesis is calculated as:

where X is a random variable that is drawn from a binomial distribution with an event probability of 0.5 and a number of trials equal to n21 + n12.
Cochran-Mantel-Haenszel test
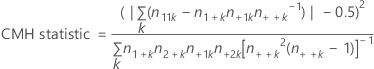
The test assumes no three-way interaction exists. The purpose of the test is to assess the degree of relationship between two dichotomous variables while controlling for a nuisance variable. The CMH statistic is compared with a chi-square percentile with one degree of freedom.
The Cochran-Mantel-Haenszel (CMH) test applies only if three or more classification variables exist, and the first two variables have two levels each. All variables beyond the first two are treated as a single variable Z for the purposes of the CMH test, with each combination of levels treated as a level of Z.
Formula
Notation
| Term | Description |
|---|---|
| k | level of Z |
| n11k | number of observations in first row, first column |
| n1+k | number of observations in first row |
| n+1k | number of observations in first column |
| n++k | total number of observations |
| n2+k | number of observations in second row |
| n+2k | number of observations in second column |