Calculating power
Formula
These calculations rely on an F-distribution with a noncentrality parameter λ.
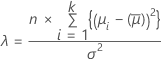
Noncentrality parameter
Power

Minitab calculates λ under the worst-case assumption that the other means are all halfway between the minimum and the maximum. The result is a configuration of the means that minimizes the power for a specified sample size and a specified maximum difference between means.
Notation
| Term | Description |
|---|---|
| k | number of levels |
| n | sample size at each level |
| α | significance level |
| σ | standard deviation |
 | degrees of freedom for error equal to k * ( n – 1 ) |
| fα | critical value (upper α point of the F distribution with k – 1 and ν degrees of freedom) |
| μi | mean response at level i |
 |  sum ( μi ) / k sum ( μi ) / k |
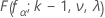 | CDF of the F distribution with k – 1 numerator degrees of freedom, v denominator degrees of freedom, and noncentrality parameter λ, evaluated at fα |
Calculating sample size and maximum difference
Formula
If you provide values for power and sample size, Minitab calculates the value of the maximum difference. If you provide values for power and maximum difference, Minitab calculates the value of the sample size.
For these two cases, Minitab uses an iterative algorithm with the power equation. At each iteration, Minitab evaluates the power for a trial sample size or trial difference, and stops when it reaches the values that you specify.
Target power and actual power
When Minitab calculates sample size, it might find that no integer value of sample size yields your target power. In such cases, Minitab displays the target value for power beside the actual power. The actual power is a value that corresponds to an integer sample size, and that is nearest to yet greater than the target value.