A quality engineer at a consumer healthcare company wants to determine whether their generic antacid is equivalent to a name-brand antacid. Two groups of participants receive a 5-day course of one antacid, followed by a 2-week washout period, and then a 5-day course of the other antacid. Group 1 receives the generic antacid (the test treatment) followed by the name-brand antacid (the reference treatment). Group 2 receives the name-brand antacid followed by the generic antacid. The engineer measures the gastric pH on the last day of each treatment. Because lower pH values are more acidic, higher values mean the drug is more effective. The engineer will consider the antacids equivalent if the test pH is within 10% of the reference pH.
The engineer performs an equivalence test for a 2x2 crossover design to determine whether the test and reference pH are equivalent. The confidence interval for the difference is not completely within the equivalence interval (–0.425, 0.425). Therefore, the engineer cannot claim equivalence between the antacids. To improve the design for the next study, the engineer uses a power and sample size calculation to estimate how large of a sample size is needed to obtain a power of 90% (0.9) for the test. From previous samples, the engineer estimates the within-subject standard deviation of the population is 0.088.
- Choose .
- From Hypothesis about, select Test mean - reference mean (Difference).
- From What do you want to determine? (Alternative hypothesis), select Lower limit < test mean - reference mean < upper limit.
- In Lower limit, enter -0.425. In Upper limit, enter 0.425.
- In Differences (within the limits), enter 0 0.1 0.2 0.3 0.4.
- In Power values, enter 0.9.
- In Within-subject standard deviation, enter 0.088.
- Click OK.
Interpret the results
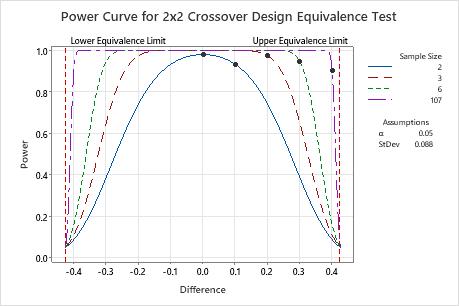
If the difference is 0.1, then the engineer needs only 2 participants in each sequence to achieve a power of at least 0.9 (the actual power is approximately 0.93).
When the difference is closer to the upper equivalence limit (0.425), the engineer needs more observations to achieve the same power. For example, for a difference of 0.4, the engineer needs at least 107 participants in each sequence to achieve a power of 0.9.
For any sample size, as the difference approaches the lower equivalence limit or the upper equivalence limit, the power of the test decreases and approaches α (alpha, which is the risk of claiming equivalence when it is not true).
Method
| Power for difference: | Test mean - reference mean |
|---|---|
| Null hypothesis: | Difference ≤ -0.425 or Difference ≥ 0.425 |
| Alternative hypothesis: | -0.425 < Difference < 0.425 |
| α level: | 0.05 |
Results
| Difference | Sample Size | Target Power | Actual Power |
|---|---|---|---|
| 0.0 | 2 | 0.9 | 0.978589 |
| 0.1 | 2 | 0.9 | 0.931544 |
| 0.2 | 3 | 0.9 | 0.972795 |
| 0.3 | 6 | 0.9 | 0.943646 |
| 0.4 | 107 | 0.9 | 0.900500 |