In This Topic
Probability Plot for Original and Transformed Data
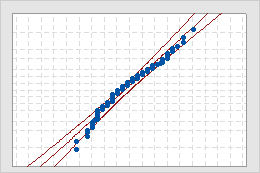
- Middle line
- The expected percentile from the distribution based on maximum likelihood parameter estimates.
- Confidence bound lines
- A left curved line indicates the lower bounds of the confidence intervals for the percentiles. A right curved line indicates the upper bounds of the confidence intervals for the percentiles.
Interpretation
Use the normal probability plots to assess how closely the original and transformed data follow the normal distribution.
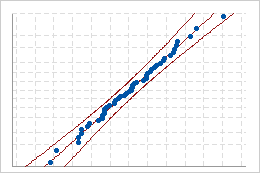
Good fit
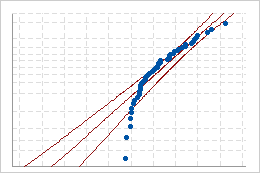
Poor fit
Note
If the original data are normally distributed, Minitab displays only a single probability plot and does not perform the Johnson transformation.
N
The number of nonmissing values in the sample. N is the count of all the observed values.
| Total | N | N* |
|---|---|---|
| 149 | 141 | 8 |
Interpretation
Use N to assess your sample size.
Important
Use caution when you interpret results from a very small or a very large sample. If you have a very small sample, a goodness-of-fit test may not have enough power to detect significant deviations from the distribution. If you have a very large sample, the test may be so powerful that it detects even small deviations from the distribution that have no practical significance. Use the probability plots in addition to the p-values to evaluate the distribution fit.
AD
The Anderson-Darling goodness-of-fit statistic (AD) is a measure of the deviations between the fitted line (based on the selected distribution) and the nonparametric step function (based on the data points). The Anderson-Darling statistic is a squared distance that is weighted more heavily in the tails of the distribution.
Interpretation
Minitab uses the Anderson-Darling statistic to calculate the p-value. The p-value is a probability that measures the evidence against the null hypothesis that the data follow the distribution.
Generally, substantially smaller values for the Anderson-Darling statistic indicate that the data follow a distribution more closely. However, avoid directly comparing AD values across different distributions when the AD values are close, because AD statistics are distributed differently for different distributions. To better compare the fit of different distributions, use additional criteria, such as the probability plots, the p-values, and your process knowledge.
P-Value
For the original and transformed data values, Minitab reports a p-value for the Anderson-Darling (AD) normality test. The p-value is a probability that measures the evidence against the null hypothesis. For an AD normality test, the null hypothesis is that the data follow the normal distribution. Therefore, smaller p-values provide stronger evidence that the data do not follow the normal distribution.
Interpretation
Use the p value to assess whether the original and transformed data follow the normal distribution. A larger p-value generally indicates a better fit for the data.
- A p-value that is less than alpha indicates that the normal distribution is not a good fit.
- A p-value that is greater than or equal to alpha indicates that there is not enough evidence of a poor distribution fit. You can assume the data follow the normal distribution.
If the Johnson transformation is effective, the p-value for the transformed data is greater than alpha.
Important
Use caution when you interpret results from a very small or a very large sample. If you have a very small sample, a goodness-of-fit test may not have enough power to detect significant deviations from the distribution. If you have a very large sample, the test may be so powerful that it detects even small deviations from the distribution that have no practical significance. Use the probability plots in addition to the p-values to evaluate the distribution fit.
Select a Transformation graph
The Select a Transformation graph plots the calculated p-value of the AD normality test for each Z-value for different Johnson transformation functions. To find the optimal Z, the Johnson transformation uses a grid of Zs over a range of 0.25 to 1.25 with an increment of 0.01 for a wide range of distributions. Minitab calculates the p-value of the transformed data for each Z and selects a transformation function that has the largest p-value that is greater than the p-value criterion specified for the analysis.
Interpretation
Use the Select a transformation graph to visualize how the Johnson transformation function is selected to produce the best fit for the data. The horizontal reference line shows the p-value criterion specified for the analysis. The vertical reference line shows the Z-value for the transformation that produces the best fit. This maximum Z-value corresponds with the minimum p-value for the AD normality test.
Note
The table below the graph (not shown here) displays the parameter estimates for the best transformation function. For more information on the algorithm that Minitab uses for the Johnson transformation function, go to Methods and formulas for transformations in Individual Distribution Identification and click "Methods and formulas for the Johnson Transformation".
P-Value for Best Fit
The p-value for best fit indicates the p-value for the Johnson transformation function that results in the best fit of the transformed data to the normal distribution. This p-value, rounded to the nearest thousandth, is also shown on the probability plot for the transformed data.
For information on how to interpret the p-value, see the section on p-value.
For information on how Minitab selects the Johnson transformation function with the best fit, see the section on the Select a Transformation graph.
Z for best fit
The Z-value for best fit indicates the Z-value for the Johnson transformation function that results in the best fit of the transformed data to the normal distribution. The optimal Z-value corresponds with the p-value for best fit, as shown on the best transformation graph.
For information on how Minitab uses the Z-value to select the Johnson transformation function with the best fit, see the section on the Select a Transformation graph.
Best transformation type
The Johnson transformation optimally selects one of the three families of distribution: SB, SL, and SU, where B, L, and U refer to the variable being bounded, lognormal, and unbounded, respectively. Minitab uses the selected distribution function to transform the data to follow a normal distribution.
For more information on the algorithm that Minitab uses to define the Johnson transformation function, go to Methods and formulas for transformations in Individual Distribution Identification and click "Methods and formulas for the Johnson Transformation".
Johnson transformation function
Minitab displays the parameters of the Johnson transformation function that produces the best fit. Minitab uses this function to transform the original data.
For example, suppose the Johnson transformation function is 0.762475 + 0.870902 × Ln((X – 46.3174) / (59.6770 – X)). If the original data value for X is 50, then the transformed data value of 50 is calculated as 0.762475 + 0.870902 × Ln((50 – 46.3174) / (59.6770 – 50)), which equals –0.07893.
Note
To store all the transformed values in the worksheet, enter a storage column when you perform the analysis.
For more information on the algorithm that Minitab uses to define the Johnson transformation function, go to Methods and formulas for transformations in Individual Distribution Identification and click "Methods and formulas for the Johnson Transformation".