What is a time-weighted control chart?
Time-weighted control charts allow detection of relatively small shifts from the target value. Time-weighted control charts tend to go out of control sooner than I-MR, Xbar-R, or Xbar-S charts when the mean of the process shifts slightly. For example, suppose that a milled part has to fit precisely with a different part, and the milling process is already in control. You can use a time-weighted control chart to detect small shifts in the process.
Time-weighted control charts can be used with individual observations or data in subgroups.
Time-weighted control charts in Minitab
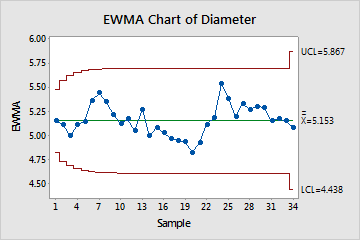
EWMA chart
A chart of exponentially weighted moving averages. EWMA charts can be customized to detect any size shift in the process and are not greatly affected when a small or large value enters the calculation.
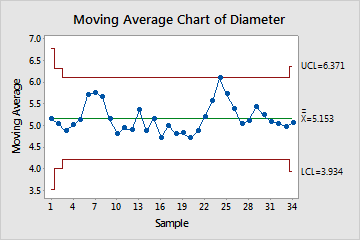
Moving average chart
A chart of unweighted moving averages. EWMA charts are generally preferred over moving average charts because they weight the observations.
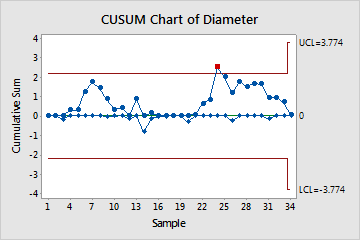
CUSUM chart
A chart of the cumulative sum of the deviations from a nominal specification. Good for detecting shifts in the mean that are 2 sigma or less.